STAT211 Lecture Notes - Lecture 3: Average Absolute Deviation, Categorical Variable, Blood Type

14 Jan 2018
School
Department
Course
Professor

Document Summary
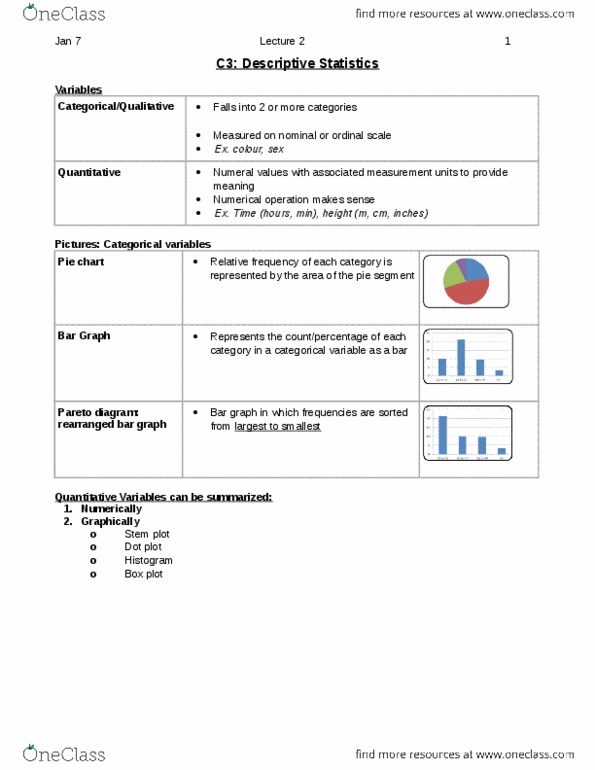
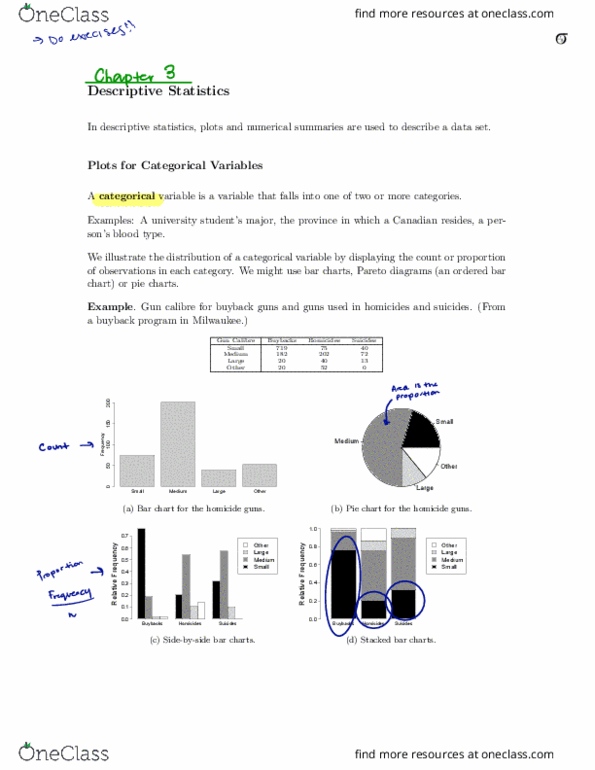
Descriptive statistics plots and numerical summaries are used to describe a data set. Plots for categorical variables: categorical variable, aka qualitative variable a variable that falls under one or more categories, describes a quality observed from a unit/individual. Student"s university program: blood type, binary variable a categorical variable with exactly two variables, can be illustrated using, bar charts. Similar to bar graphs, but there are no spaces between the bars (classes: do not retain exact values. Split each observation into a stem and a leaf (tens and ones) List stems in ascending order in a column. List leaves in ascending order by their stems. Symmetrical: distribution is approximately normal (bell-shaped, perfectly symmetrical distributions rarely occur in real life. Skewed: asymmetric a distribution that is not symmetric. Skewed towards the left: negatively skewed, lots of large numbers. Skewed towards the right: positively skewed, lots of small numbers, unimodal single peak, data can also be bimodal or multimodal.