SOCI 328 Lecture Notes - Lecture 13: Null Hypothesis, Alternative Hypothesis, Dependent And Independent Variables

Document Summary
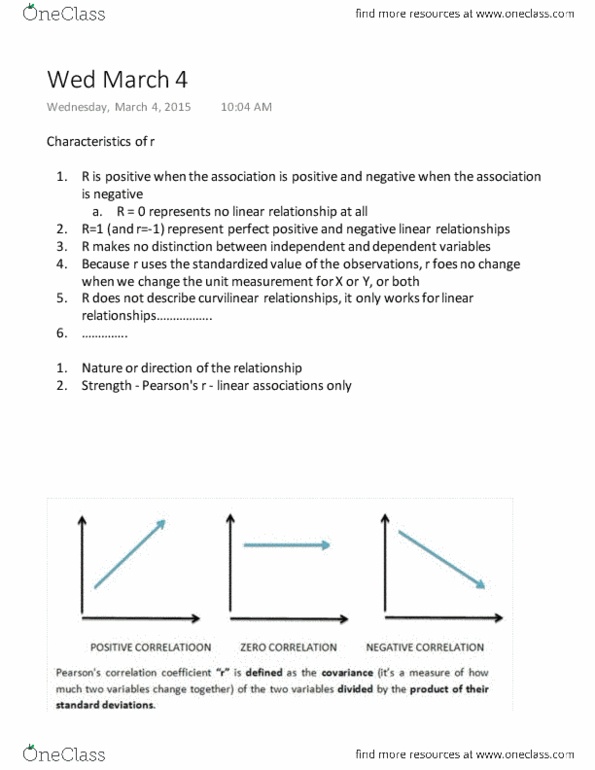
Examine three aspects of relationship between two interval-ratio variables: nature/direction of relationship, strength of relationship. If sample is randomly drawn from a population, whether the relationship is statistically significant. Negative: if points tend to go down. When we can meaningfully differentiate between independent and dependent variable, independent variable should form x-axis and dependent variable should form y axis. When y larger as x larger = positively associated variable. When y smaller as x larger =negatively associated variable. Relationship linear if general tendency of points follows straight line: curvilinear if pattern of points follows wavy or curvy path, outliers, points that deviate strikingly from overall pattern. Pearson"s r measures the direction and strength of a linear relationship between two interval-ratio variables: pearson"s r also refered to as r, pearson"s correlation, correlation or correlation coefficient. Test of significance for pearson"s r: rho = correlation between x and y in population, null hypothesis: rho = 0, alternative hypothesis: rho not equal to 0.