HSS 2381 Lecture Notes - Lecture 2: Interquartile Range, Quartile, Central Tendency

10 Oct 2018
School
Department
Course
Professor
Document Summary
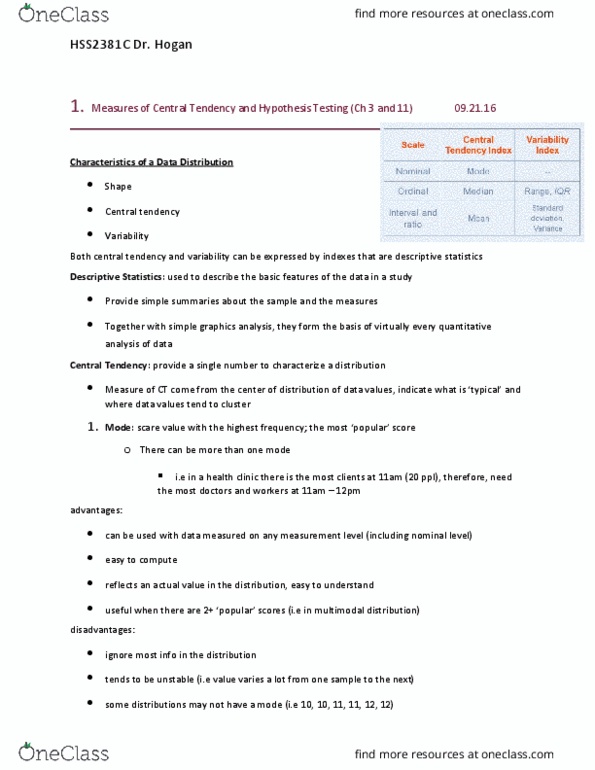
Central tendency: tendency of a set of data to centre or cluster around certain numerical values, mean is the average, median is the date point that separates the values equallty, mode is the most frequent data set. Quartiles: q2 is always at the 50, first step is reorder data, second step is to always find q2, q1 is middle value of first half and q3 is middle value of second half. Integrate 7. 5 into data set as q2 (even numbered ex) Measures of variability: the (cid:272)u(cid:396)(cid:448)e"s (cid:272)e(cid:374)t(cid:396)al poi(cid:374)t (cid:374)e(cid:448)e(cid:396) (cid:272)ha(cid:374)ges, the o(cid:374)l(cid:455) thi(cid:374)g that (cid:272)ha(cid:374)ges is the (cid:449)idth. Range: max number minus the min number in the data set, sensitive to outliers. Box and whisker plot: whe(cid:374) (cid:455)ou see a (cid:271)o(cid:454) it auto(cid:373)ati(cid:272)all(cid:455) (cid:373)ea(cid:374)s (cid:455)ou"(cid:396)e deali(cid:374)g (cid:449)ith a (cid:395)ua(cid:396)tile. If you have a reasonable amount of data there are 2 outlier equations.