STA215H5 Lecture Notes - Lecture 6: Covariance, Confounding, Standard Deviation


STA215; Chapter 6
Motivating Examples;
● Is the price of running shoes related to how long they last?
● Is the number of blueberries you eat related to how good your memory is?
● Do students learn better when they get more sleep?
● Questions such as these relate two quantitative variables and ask whether there is an
association between them. In this chapter, we will look at relationships between two
quantitative variables to see how we can answer questions like these
Definitions;
● A response variable measures an outcome of a study.
● An explanatory variable may explain or influence changes in a response variable.
○ We usually call the explanatory variable x and the response variable y.
● Example; Using one of our motivating examples, suppose we are interested in finding
out if the price of running shoes is related to how long they last. To find out, we
sampled 65 pairs of running shoes ranging from $40 − $300 from a shoe store and
told elementary school students to wear them everyday until the shoes break. The
length of time the shoes lasted was recorded. What are the explanatory and
response variables?
○ In this example, our explanatory variable is the price of the running shoes and
our response is how long they last. Both are quantitative
Scatterplot
● A great way to visually display relationships between two quantitative variables is
through scatterplots.
● The values of one variable appear on the horizontal axis, and the values of the other
variable appear on the vertical axis.
● Each individual observation in the data appears as a point in the plot fixed by the
values of both variables for that observation.
● How to make scatter plot;
○ Always plot the explanatory variable, if there is one, on the horizontal axis (the
x axis) of a scatter plot.
○ If there is no explanatory-response distinction, either variable can go on the
horizontal axis
○ Example;
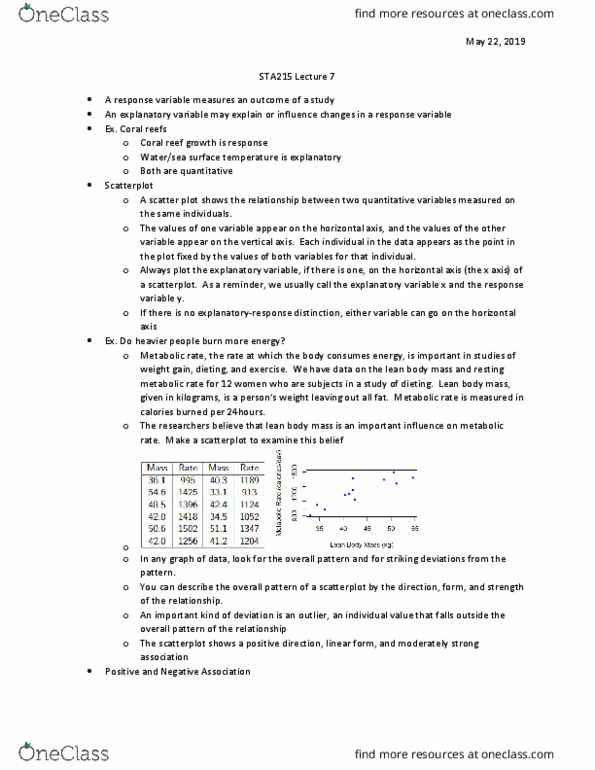
■ Researchers believe that lean body mass has an important influence
on metabolic rate. Let’s make a scatterplot to examine the belief on
metabolic rate

■
● Examining Scatterplots;
○ In any graph of data, we want to look for the overall pattern and for striking
deviations from the pattern. In particular, you can describe the overall pattern
of a scatter plot by its:
■ direction
■ form
■ strength
■ unusual features (i.e. outliers)
○ Direction; Positive and Negative Association
■ Two variables are positively associated when above-average values of
one tend to accompany above-average values of the other, and
below-average values also tend to occur together.
●
■ Two variables are negatively associated when above-average values
of one tend to accompany below-average values of the other, and vice
versa
●
■ No association
Document Summary
Questions such as these relate two quantitative variables and ask whether there is an association between them. In this chapter, we will look at relationships between two quantitative variables to see how we can answer questions like these. A response variable measures an outcome of a study. An explanatory variable may explain or influence changes in a response variable. Example; using one of our motivating examples, suppose we are interested in finding. We usually call the explanatory variable x and the response variable y. out if the price of running shoes is related to how long they last. To find out, we sampled 65 pairs of running shoes ranging from from a shoe store and told elementary school students to wear them everyday until the shoes break. The length of time the shoes lasted was recorded. In this example, our explanatory variable is the price of the running shoes and our response is how long they last.