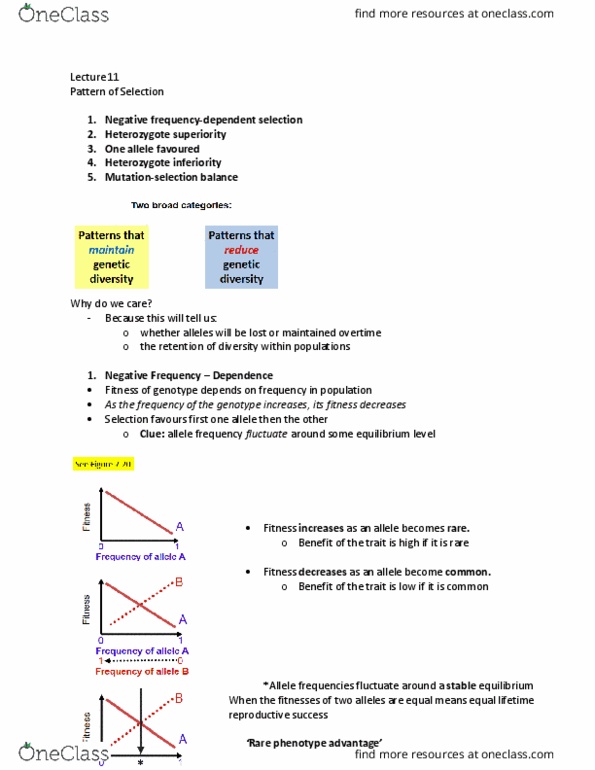
BIOB51H3 Lecture Notes - Lecture 11: Frequency-Dependent Selection, Allele Frequency, Negative Frequency

Get access


Related Documents
Related Questions
Hemoglobin and Fitness Instructions Directions: Neutral Evolution
1. Obtain 20 beans of two different colors (e.g., white and red). Count out 16 white and 4 red beans. The white beans represent the Hn allele and the red beans represent the Hs allele. This is the genetic makeup of your starting population. (Note: You can use any objects that can readily be categorized into two groups, such as coins, colored rocks, or paper clips.)
2.Calculate the frequency of both alleles [f(Hn) and f(Hs)] and record them in Table 1. In our experiment frequency is a measure of how many copies of a given allele exist in the gene pool (i.e., a proportion). Use decimal values. â¨
3.Arrange the beans into pairs. These pairs represent the genotype of each of 10 individuals in the population. Record the number of individuals with each genotype [f(Hn Hn), f(Hn Hs), and f(HsHs)] in Table 1. â¨
4.Now imagine that the individuals are living and reproducing with each individual reproducing at the same rate (i.e., all individuals produce two copies of each of their alleles into the next generation). Obtain enough beans to represent the next generationâ the offspring generationâand then let the parental generation âdieâ. â¨
5.Calculate the frequency of each allele in the offspring generation and record it in Table 1. â¨
Answer the questions that follow in Table 1. â¨
Table 1
| f(HnHn) | f(HnHs) | f(HsHs) | f(Hn) | f(Hs) | |
| oiginal generation | |||||
| offspring generation |
Answer the following questions to help you understand the exercise:
What happened to the frequency of the common allele? â¨
What happened to the frequency of the rare allele? â¨
What happened to the frequency of the common and rare alleles when the starting frequencies were different from yours
What happens to allele frequencies from one generation to the next if there are no evolutionary forces acting on the population? â¨

Dr. sisko studies the flowering plant Mimulus cardinalis in an experimental population of size 1000 that grows in acidic soil. The color of the flower in this plant is determined by a single locus with two co-dominant alleles A1 and A2. Laboratory observations show that seeds from red and pink flower plants survive with equal success in the acidic soil but seeds from plants with white flowers (A2A2) have decreased fitness with a selection coefficient of s=0.2
| Phenotype | Red (A1A1) | Pink (A1A2) | White (A2A2) |
| # plants (adults) | 200 | 300 | 500 |
| Fitness | 1.0 | 1.0 | 1-s |
1) Calculate the allele frequencies in the next generation before selection.
2) Calculate the allele frequencies in the next generation after selection.
3) Calculate the genotype frequencies in the next generation after selection.

