BIOC34H3 Lecture Notes - Lecture 2: Bradycardia, Peritonitis, Coronary Circulation

Document Summary
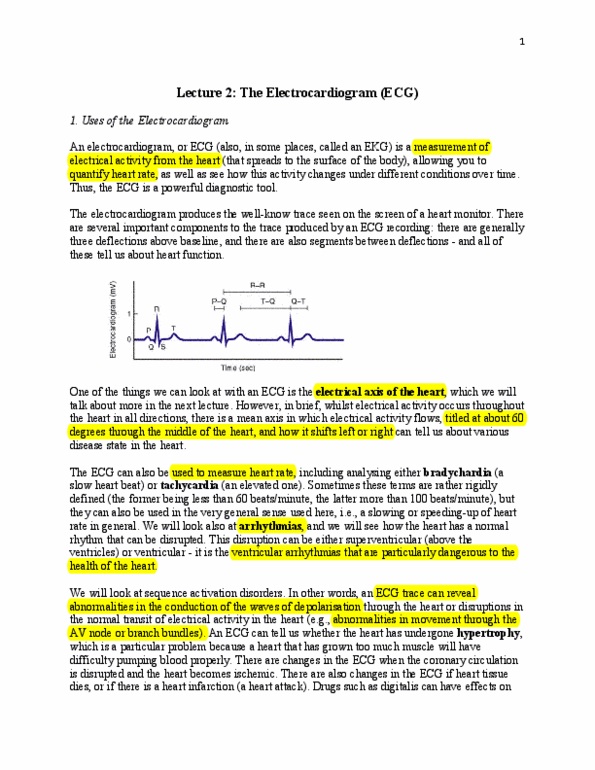
Lecture 2: the electrocardiogram (ecg: uses of the electrocardiogram. Thus, the ecg is a powerful diagnostic tool. The electrocardiogram produces the well-know trace seen on the screen of a heart monitor. The trace below is the stereotypical trace that you see when an ecg is recorded using a standard lead ii limb lead configuration (see below). The traces can and will look different depending upon which electrode lead configuration is in use (see below). There are several important components to the trace produced by an ecg recording. These will look different with different lead configurations but for a standard trace there are generally three deflections above baseline, and there are also segments between deflections - and all of these tell us about heart function. One of the things we can look at with an ecg is the electrical axis of the heart, which we will talk about more in the next lecture.