MGEA02H3 Lecture Notes - Lecture 6: Utility, Demand Curve, Economic Surplus

24 Feb 2015
School
Department
Course
Professor


38
MGEA02H3 Full Course Notes
Verified Note
38 documents
Document Summary
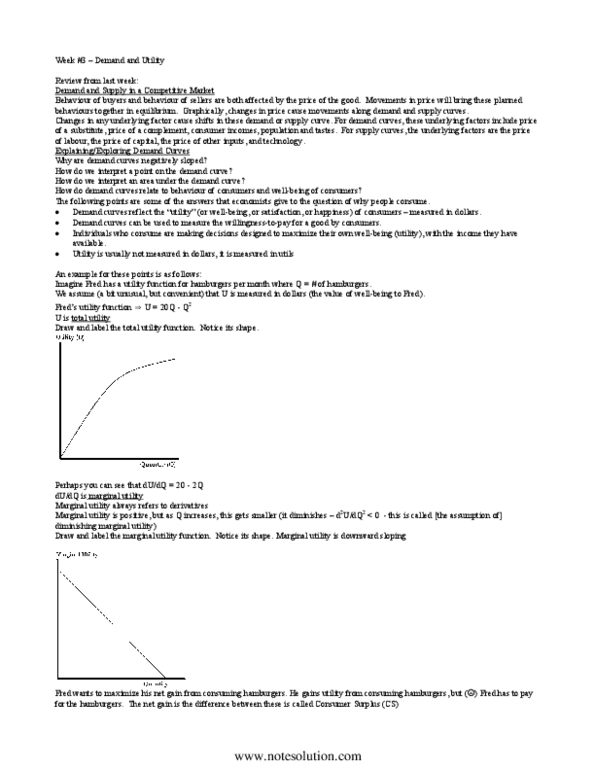
Explaining/exploring demand curves (parts of chapter 10 and chapter 4 in. Demand curves reflect the utility (or well-being, or satisfaction, or happiness) of consumers measured in dollars. Another way of putting it: the height of a demand curve and the area under the demand curve both reflect the willingness-to-pay for a good by consumers. Invididuals who consume are making decisions designed to maximize their own well-being (utility), with the income they have available. Imagine fred has a utility function [u(q)] for hamburgers per month where q = # of hamburgers. We assume (a bit unusual, but convenient) that u is measured in dollars (the value of well-being to. Fred"s utility function [u(q)] u = 20q - q2. Perhaps you can see that du/dq = 20 - 2q du/dq is marginal utility. Marginal utility is positive, but as q increases, this gets smaller (it diminishes d2u/dq2 < 0 - this is called [the assumption of] diminishing marginal utility)