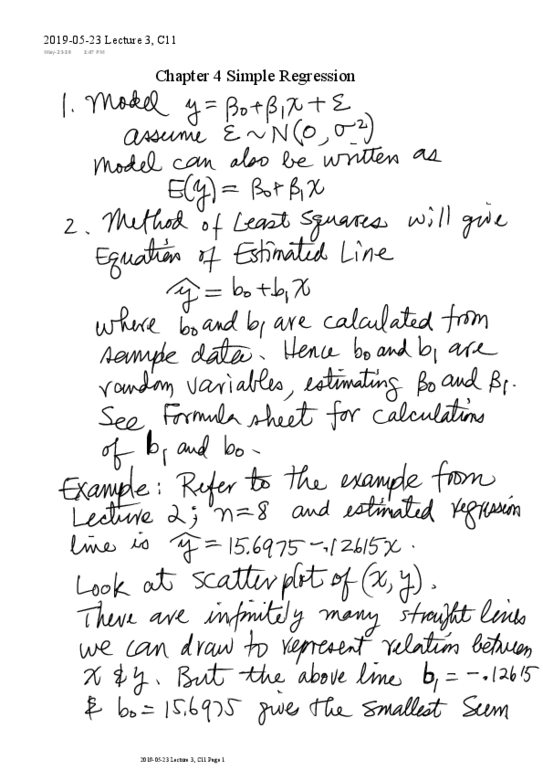
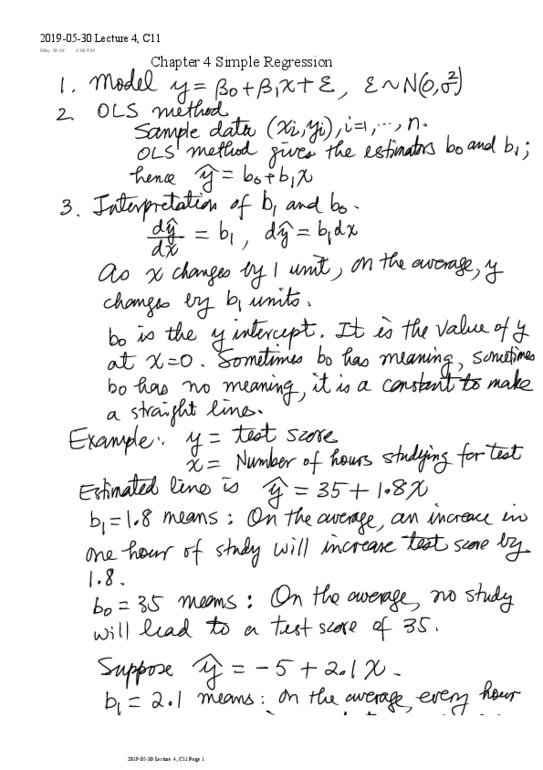
MGEC11H3 Lecture 2: 2019-05-16 Lecture 2, C11

Get access


Related Documents

Related Questions
| The Demand for soft drink (in cans per capita per year) is estimated as Log Q = a + b log P+ c log I + d log T | ||||||||||||||||||||||||||||||||||||||||||||||||||||||||||||||||||||||||||||||||||||||||||||||||||||||||||||||||||||||||||||||||||||||||||||||||||||||||||||||||||||||||||||||||||||||||||||||||||||||||||||||||||||||||||||||||||||||||||||||||||||||||||||||||||||||
| where Q = Soft drink consumption in cans per capita per year | ||||||||||||||||||||||||||||||||||||||||||||||||||||||||||||||||||||||||||||||||||||||||||||||||||||||||||||||||||||||||||||||||||||||||||||||||||||||||||||||||||||||||||||||||||||||||||||||||||||||||||||||||||||||||||||||||||||||||||||||||||||||||||||||||||||||
| P = 6-pack price | ||||||||||||||||||||||||||||||||||||||||||||||||||||||||||||||||||||||||||||||||||||||||||||||||||||||||||||||||||||||||||||||||||||||||||||||||||||||||||||||||||||||||||||||||||||||||||||||||||||||||||||||||||||||||||||||||||||||||||||||||||||||||||||||||||||||
| I = Income Per capita | ||||||||||||||||||||||||||||||||||||||||||||||||||||||||||||||||||||||||||||||||||||||||||||||||||||||||||||||||||||||||||||||||||||||||||||||||||||||||||||||||||||||||||||||||||||||||||||||||||||||||||||||||||||||||||||||||||||||||||||||||||||||||||||||||||||||
| T = Mean temperature across the 48 contiguous states in the United States | ||||||||||||||||||||||||||||||||||||||||||||||||||||||||||||||||||||||||||||||||||||||||||||||||||||||||||||||||||||||||||||||||||||||||||||||||||||||||||||||||||||||||||||||||||||||||||||||||||||||||||||||||||||||||||||||||||||||||||||||||||||||||||||||||||||||
| ||||||||||||||||||||||||||||||||||||||||||||||||||||||||||||||||||||||||||||||||||||||||||||||||||||||||||||||||||||||||||||||||||||||||||||||||||||||||||||||||||||||||||||||||||||||||||||||||||||||||||||||||||||||||||||||||||||||||||||||||||||||||||||||||||||||
|
( Data in Excel have been saved in the folder of Exam I on weekly study materials In order to receive full points, you need to show me in details how to get your answers. ) 1) What is regression equation using multiple linear regression model? How would you interpret the coefficients of each independent variable in the model? (5 points)
2) What is price elasticity of demand ? How would you interpret it? (5 points) | ||||||||||||||||||||||||||||||||||||||||||||||||||||||||||||||||||||||||||||||||||||||||||||||||||||||||||||||||||||||||||||||||||||||||||||||||||||||||||||||||||||||||||||||||||||||||||||||||||||||||||||||||||||||||||||||||||||||||||||||||||||||||||||||||||||||
| 3) The approximate percentage increase or decrease in demand if 6-pack price percentage increases by 3%. ****MUST SHOW ALL WORK | ||||||||||||||||||||||||||||||||||||||||||||||||||||||||||||||||||||||||||||||||||||||||||||||||||||||||||||||||||||||||||||||||||||||||||||||||||||||||||||||||||||||||||||||||||||||||||||||||||||||||||||||||||||||||||||||||||||||||||||||||||||||||||||||||||||||

You are the manager of Meals on Wheels, a non-profit organization that delivers prepared meals to elderly citizens. Five new volunteers have joined your organization, and it is your job to assign each volunteer to a neighborhood where they will make deliveries. Your organization serves two areas: Uptown and Downtown. Based on the distances between homes, traffic volumes, and the number of people served, you have calculated the following data for the productivity of volunteers in each neighborhood:
|
Uptown |
Downtown |
||||||
|
# Volunteers |
MP |
AP |
TP |
# Volunteers |
MP |
AP |
TP |
|
1 |
24 |
24 |
24 |
1 |
16 |
16 |
16 |
|
2 |
20 |
22 |
44 |
2 |
14 |
15 |
30 |
|
3 |
13 |
19 |
57 |
3 |
12 |
14 |
42 |
|
4 |
7 |
16 |
64 |
4 |
10 |
13 |
52 |
|
5 |
1 |
13 |
65 |
5 |
8 |
12 |
60 |
Consistent with the organization's goals, your responsibility is to allocate the five new volunteers so as to maximize the number of people served. To do this, how many of the volunteers should be assigned to Uptown, and how many should be assigned Downtown? Explain how you know this (without simply saying that you added up all the combinations and found the largest value.
