PHYA10H3 Lecture Notes - Lecture 3: Khanqah, Opata Language

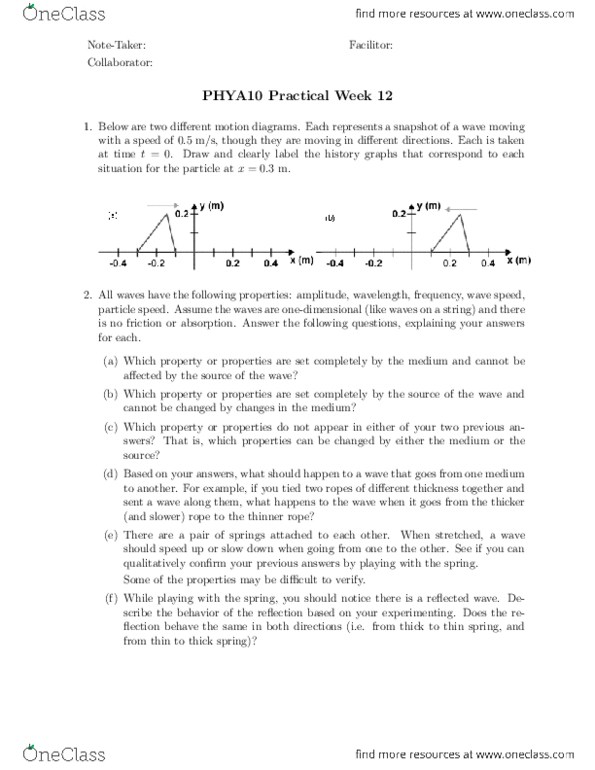
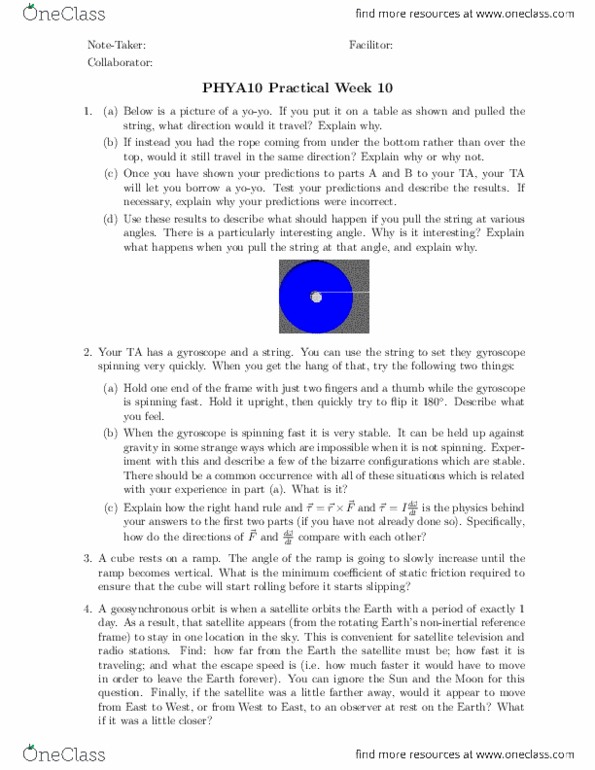
15 Jan 2016
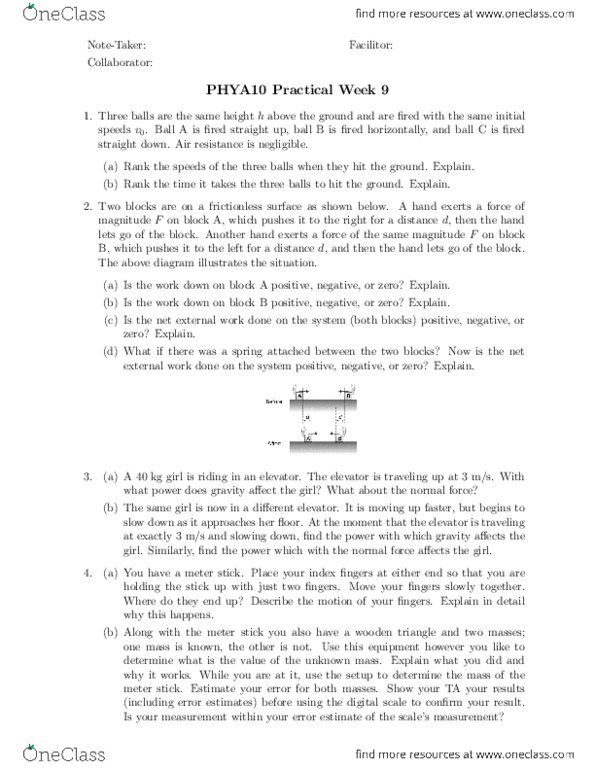
School
Department
Course
Professor

Document Summary
Phya10 practical week 3: a cart slides down an air track. You measure the distance d traveled after 1, 2 and 3 seconds, running 5 trials for each time. Your data is as shown in the table below. All measurement uncertainties are 0. 01 seconds for the time and 0. 005 m for the distances. Use this data to plot a distance-time graph, including uncertainties, using the average distance for each time. Use the computer to t a polynomial so you can nd the acceleration. 0. 488 m 0. 556 m 0. 445 m 0. 423 m 0. 515 m. 1. 861 m 1. 922 m 1. 879 m 1. 993 m 1. 950 m. Explain. (c) draw a velocity-time graph for this object. (d) draw an acceleration-time graph for this object: a car starts from rest. It accelerates at a rate which constantly increases and is described by the equation a(t) = 1. 5t m/s3. Use this model to estimate their top speed.