STAB22H3 Lecture Notes - Lecture 4: Unimodality, Histogram


38
STAB22H3 Full Course Notes
Verified Note
38 documents
Document Summary
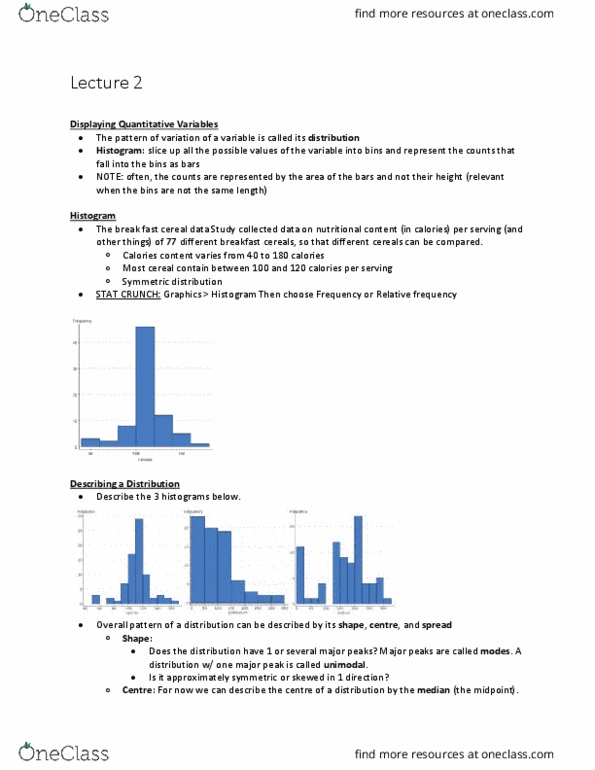
Iii displaying and summarizing quantitative data (p. 52) displaying. Quantitative variables and describing the distribution: displaying quantitative variables. The pattern of variation of a variable is called its distribution. Histogram: slice up all the possible values of the variable into bins and represent the counts that fall into the bins as bars. Note: often, the counts are represented by the area of the bars and not their height (relevant when the bins are not of same length). When describing a distribution, we must look for the overall pattern and for striking deviations from that pattern (e. g. gaps). An important kind of deviation is an outlier, an individual value that falls outside the overall pattern. Overall pattern of a distribution can be described by its shape, centre, and spread. A distribution with one major peak is called unimodal. Centre: for now we can describe the centre of a distribution by the median (the midpoint).