GGR270H1 Lecture Notes - Lecture 2: Variance, Weighted Arithmetic Mean, Euclidean Distance

7 Sep 2016
School
Department
Course
Professor

Document Summary
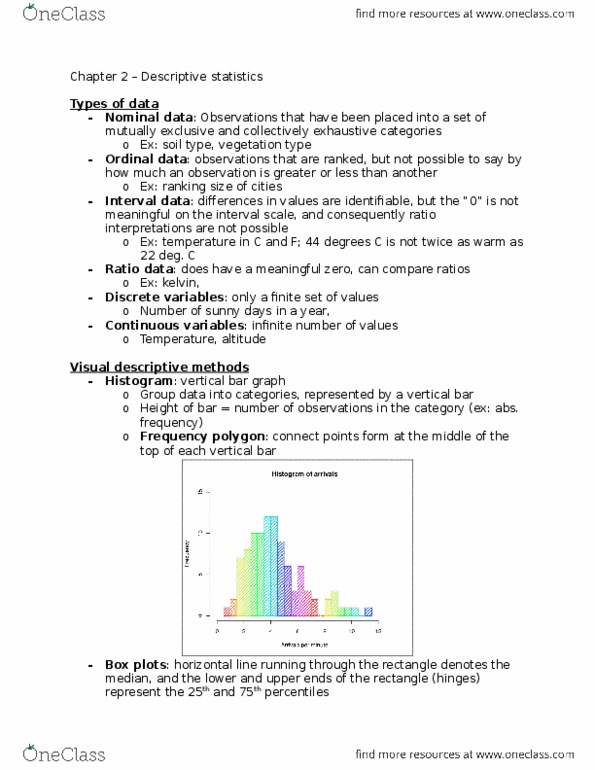
Data may be classified as nominal, ordinal, interval, or ratio: nominal data: observ. placed into a set of mutually exclusive & collectively exhausted categories. E. g. soil type, vegetation type, area codes: ordinal data: observations that are ranked, shows a sequence or ranking. Not able to say by how much an observation is greater or less than another. When possible to say by how much one observation is greater/less than another data is ordinal or ratio. Interval data: differences in values are identifiable but 0 is not meaningful. E. g. temperature (fahrenheit and celsius: ratio data: meaningful differences values, natural 0 (nothing is less than 0) We may summarize our data visually by constructing a. Box plots (way of displaying the distribution of data based on the 5 number summary) Stem-and-leaf (plot where the leading digits are the stem, and trailing digits make leaf) Sample mean (): average of our observations (all of the individual values divided by number of values)