GGR272H1 Lecture Notes - Lecture 6: Cmyk Color Model, Level Of Measurement, Arcgis

Document Summary
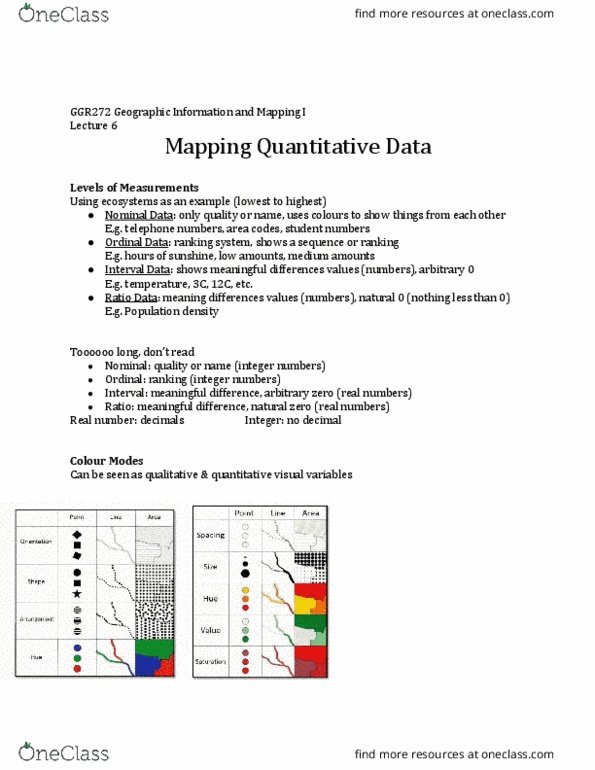
May 25: lecture 6 - mapping quantitative data. Lowest level of measurement - nominal data (only represents quality or name) Ordinal data - represents sequence or ranking of discrete classes (can test for quality and ranking - but don"t know quantity) Interval data - meaningful difference but arbitrary zero (can test quantitative difference between regions) -- arbitrary zero (e. g. temperature relates to heat energy - lowest is not zero, meaning is drawn from differences). Can relate using addition and subtraction: 10 degrees is not 2 times hotter than 5 degrees. Ratio data - no numbers less than zero (e. g. population density). Can relate using addition, subtraction, multiplication, and division: population density can be twice as dense in one region compared to another. Qualitative: for nominal data: can differentiate using: orientation, shape, arrangement, hue. Quantitative: for ordinal, interval, or ratio: can differentiate using: spacing, size, hue, value, saturation.