GGR272H1 Lecture Notes - Lecture 7: Level Of Measurement, Digital Elevation Model, Cartogram

7 Sep 2016
School
Department
Course
Professor
Document Summary
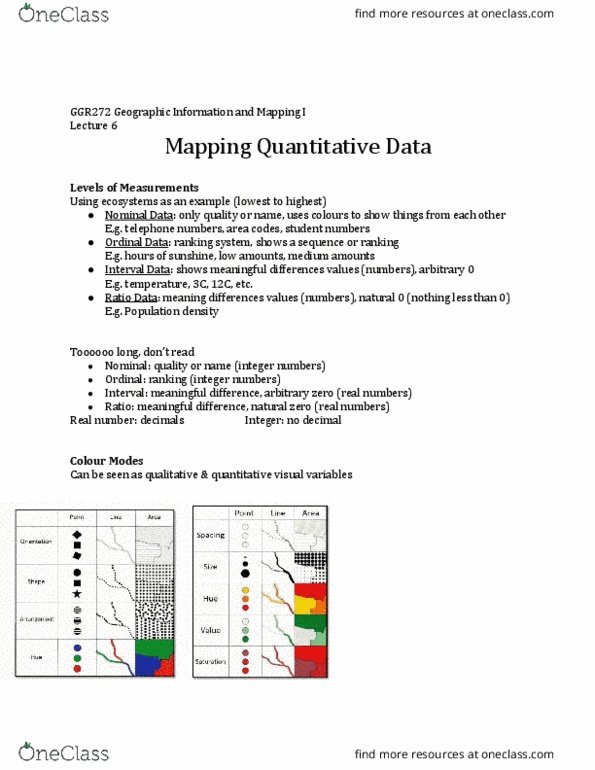
Choropleth maps: visually show quantities over an area e. g. pop density in wards. Dot maps: visually show the density of something across an area. Background: dot density maps use to take months, if not years to create but allowed human understanding of spatial relationships to be exercised and allowed us to have more control on how a map looked/was created visually. In the modern day, computers and related software take a matter of seconds but we have less control on how particular information is represented visually. It is important to understand that this map places dots randomly all over an area. It is not a good representation of population density as it evenly distributes dots, when in fact population is sparse and denser in particular areas. To fix this, we strategically used census tracks/dissemination. Remove census tracks from the map to hide your strategy . Limit is based on you dot limit (1 dot = 1000 people)