MSE101H1 Lecture Notes - Liquidus, Phase Boundary, Phase Diagram

3 Feb 2014
School
Department
Course
Professor
Document Summary
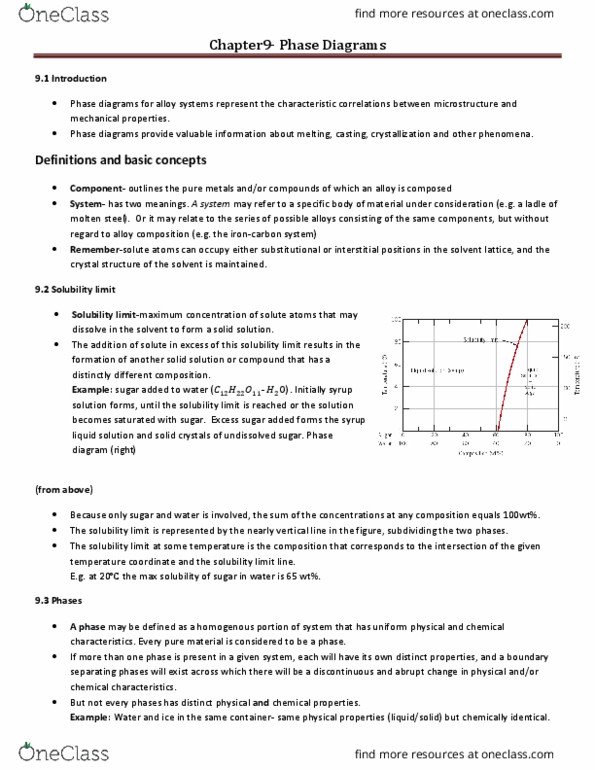
Solution (a) we are asked to determine how much sugar will dissolve in 1000 g of water at 80 c. From the solubility limit curve in figure 10. 1, at 80 c the maximum concentration of sugar in the syrup is about 74 wt%. It is now possible to calculate the mass of sugar using equation 5. 6 as. Csugar(wt%)=msugarmsugar mwater 100 74 wt%=msugarmsugar 1000g 100 (m"sugar) 64 wt%=m sugarm sugar 1000g 100 which yields a value for of 1778 g. subtracting the latter from the former of these sugar concentrations yields the amount of sugar that precipitated out of the solution upon cooling. 10. 3 consider a specimen of ice that is at 15 c and 10 atm pressure. Using figure 10. 2, the pressure temperature phase diagram for h2o, determine the pressure to which the specimen must be raised or lowered to cause it (a) to melt, and (b) to sublime.