SOC202H1 Lecture 3: - Jan 23

Document Summary
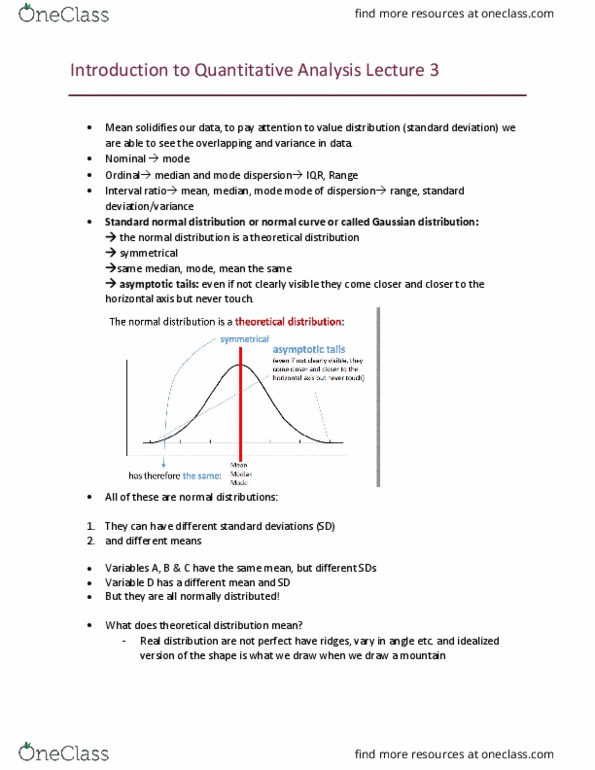
The normal distribution is a theoretical model with several special features: bell shaped, unimodal one mode, symmetrical each side is the same, unskewed no skew, mode, median, and mean are same value. The area under a normal distribution sums to 1. This area can be thought of as a set of probabilities. Normal curve captures the distribution of certain random events namely the long term patterns of observations we can expect if we took random sample from a population. Don"t ever fully touch down on x-axis, become increasingly closer but not touching, assymotictic. In the normal distribution: with mean ( ) and standard deviation (s): Approximately 68% of the observations fall within 1 standard deviation of the mean. Approximately 95% of the observations fall within 2 standard deviations of the mean. Approximately 99. 7% of the observations fall within 3 standard deviations of the mean.