SOC202H1 Lecture Notes - Lecture 10: General Linear Model, Stellar Population, Null Hypothesis

Document Summary
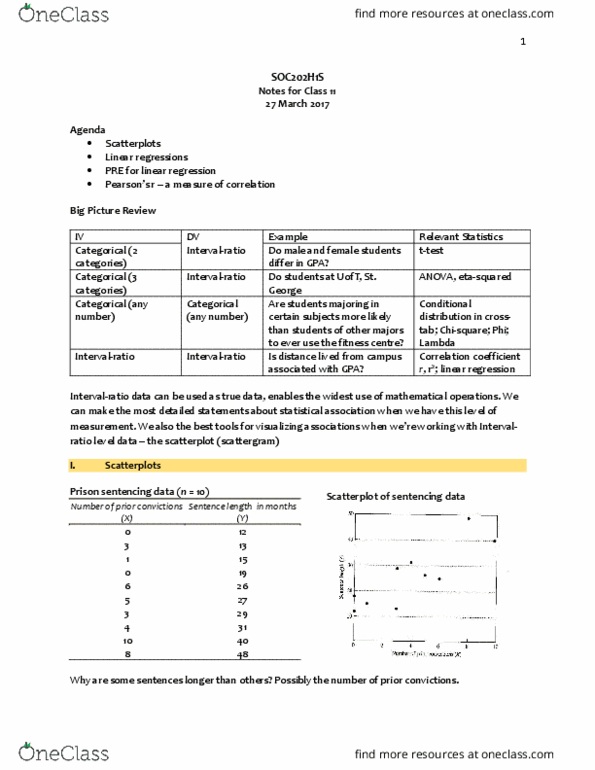
Pearson"s r- a measure of correlation ( stat that ranges from -1 to +1) Do male and female students differ in gpa? t-test. There will be a question on the exam which will show variables; you will have to figure out the level of measurement and the statistical tool or method to use. Recall from the beginning stages of this class- we discussed how interval-ratio level data enable the widest use of mathematical operations. Not surprisingly, then, we can make the most detailed statements about statistical association when we have this level of measurement. We also have the best told for visualizing associations when we"re working with interval ratio level data- the scatterplot (scattergram). Judge hands out different types of sentences (varies in time length- months to years) What might explain the variation of the length of sentences . Form: linear, curved, no pattern, clusters, outliers (deviations from the overall form) Strength: how closely the points fit the form .