STA221H1 Lecture Notes - Lecture 12: Simple Linear Regression, Pectin, Scatter Plot

23 Feb 2018
School
Department
Course
Professor
Document Summary
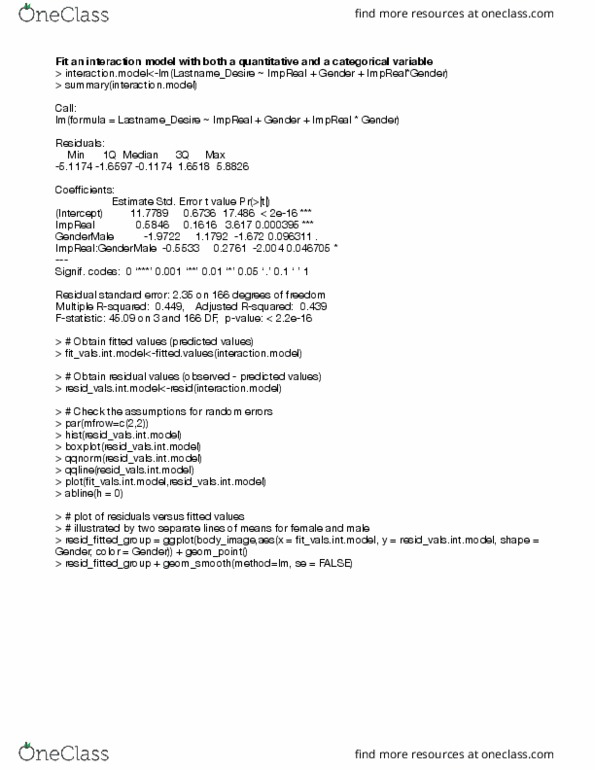
> # see if simple linear regression model is an appropriate model to t the data. > # use the function lm (linear model) to obtain least squares estimates. Error t value pr(>|t|) (intercept) 6. 2520679 0. 2366220 26. 422 <2e-16 *** Signif. codes: 0 ***" 0. 001 **" 0. 01 *" 0. 05 . " 0. 1 " 1. Residual standard error: 0. 215 on 22 degrees of freedom. F-statistic: 6. 52 on 1 and 22 df, p-value: 0. 01811. > # predict sweetness index when amount of pectin is 300 ppm. > # predict sweetness index when amount of pectin is 220 ppm. > # use predict. lm function and pass the two arguments below. > # obtain the tted values (predicted sweetness for each pectin amount in data) > # obtain the residual values (observed - predicted sweetness for each pectin amount) > # display data information (pectin, sweet_aslemand), tted values, and residual values.