ECON 1100 Lecture Notes - Lecture 4: Demand Curve, Normal Good, Inferior Good
13 views5 pages

3 Sep 2019
School
Department
Course
Professor
Document Summary
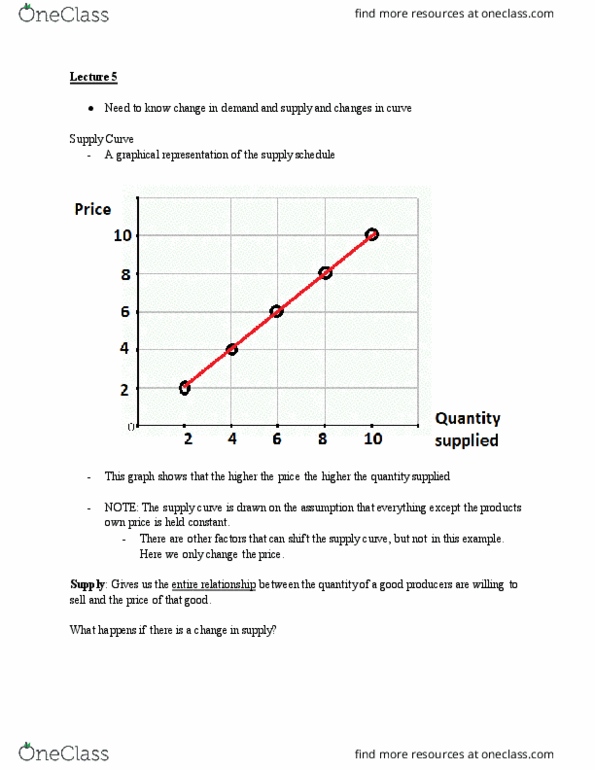
Demand curve: a graphical representation of the demand schedule. A demand curve is drawn on the assumption that everything, except the products own price is held constant. Demand refers to the entire relationship between the quantity of a good buyers want to purchase and the price of that good, other things being equal. D1: let"s say this is the normal demands. D2: shows an increase in demand at a fixed price point. D3: shows a decrease in demand at a fixed price point. Note: when there is an increase in demand, the demand curve will shift to the right. In the above example a), electric cars, bikes, ect, are called substitute goods to cars that use gasoline. Their demand will increase to substitute the decrease demand of gas. In the above example b), sharpeners and erasers are complement goods, to pencils. So thus expectation influences your economic choices of today: taxes, ie: think of foreign buyer tax in vancouver.
Get access
Grade+20% off
$8 USD/m$10 USD/m
Billed $96 USD annually

Homework Help
Study Guides
Textbook Solutions
Class Notes
Textbook Notes
Booster Class
40 Verified Answers
Class+
$8 USD/m
Billed $96 USD annually

Homework Help
Study Guides
Textbook Solutions
Class Notes
Textbook Notes
Booster Class
30 Verified Answers