Experiment 1: Paper Chromatography
I need all the data tables and questions filled out!
Chromatography is routinely used to separate components of a mixture. In this experiment, you will perform a paper chromatography procedure. The objective for this experiment is to determine the best solvent (ionic, polar covalent or non-polar covalent) for the dyes found in candy-coated chocolate pieces. The chromatography paper acts as the stationary phase for the procedure, and a variety of mobile phases (solvents) will be tested. Multiple tests with different eluting solvents must be run to determine the best eluting solvent to separate the food dyes. Some of the factors you will investigate include polarity and electrical charge (ionic characteristics).
Chromatography is based on two phases: the mobile phase and the stationary phase. The mobile phase is the phase which moves up the chromatography paper. This is also referred to as the eluting solvent, which the mixture of analytes is placed in.
The stationary phase is the material held in place for the chromatography procedure. Think of the mobile phase as a moving stream and the stationary phase as the stream bed. If you were to toss in a leaf, a stick, and a large rock, what would happen? Each different component would travel at different rates along the stationary phase, using the mobile phase as a vehicle. Many properties affect the affinity of a substance for the mobile or stationary phase, including polarity, solubility, particle size and electrical charge. Chemists can use their knowledge of these properties to separate a mixture effectively.
| Materials (3) 50 mL Beakers
1 Pipette
1 Stir Rod
10 mL Graduated Cylinder
100 mL Graduated Cylinder
(6) 5.5 x 9 cm. Pieces of Chromatography Paper
3 Capillary Tubes
600 mL Beaker
Ruler
*36 M&Ms® (12 Blue, 12 Green, and 12 Red)
30 mL of each of the following eluting solvents:
0.5% Sodium Chloride (Salt), NaCl solution | 0.2% Sodium Chloride (Salt), NaCl solution
*Distilled Water (eluting solvent)
*70% Isopropyl Alcohol, C3H8O
*Create Your Own: Use your knowledge of eluting solvents to create two additional eluting solvents (30 mL each).
*Pencil
*20 mL 70% Isopropyl Alcohol, C3H8O
*Note: The individual candies have been repackaged by eScience Labs. Do not eat the candies.
*You must provide |
Procedure:
1. Gather three 50 mL beakers, one for each color candy you will test.
2. Place two M&Ms® candies of one color into a beaker.
3. Repeat for each color of the candy you will test. You should have two green candies in one beaker, two red candies in a second beaker, and two blue candies in the third beaker.
Preparation of the Analyte
4. Use a pipette and the 10 mL graduated cylinder to add one mL of 70% isopropyl alcohol to each beaker.
5. Stir gently with a stir rod until the candy's white undercoating appears. Remove the candies. Be sure to rinse the stir rod every time you insert it into a new beaker.
6. Allow the solutions to sit and concentrate while stationary phase is prepared.
Preparation of Stationary Phase
7. Obtain a piece of chromatography paper that is approximately 5.5 cm wide and 9.0 cm long.
8. Using a pencil, mark the paper according to the sample provided in Figure 7 at the end of the procedure.
9. Using a capillary tube, place small spots of the analyte equally spaced along the marked line. Since there are three colors to be tested, there will be three spots on the line (use one capillary tube per color; save the tubes for the additional trials).
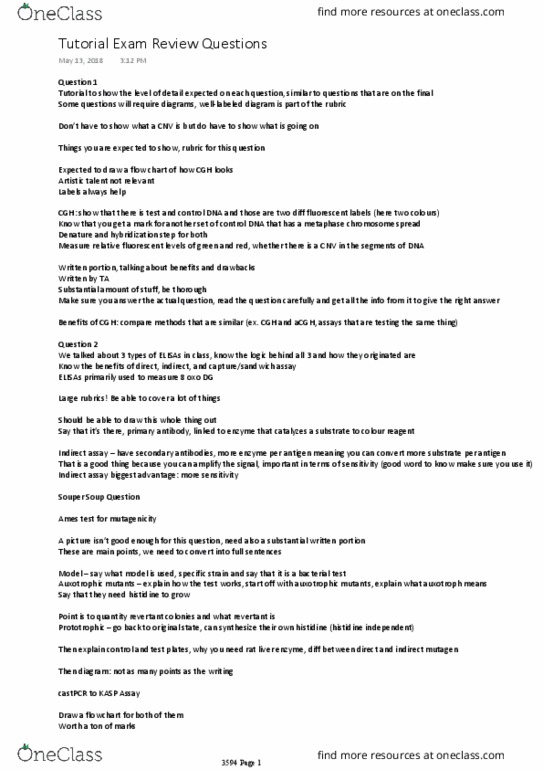
Note: Capillary tubes are extremely thin tubes. They are useful when working with very small amounts of a sample, and collect liquid samples through capillary action. To use the capillary tube, simply place the open end of the tube in the sample. The liquid molecules will be drawn into the tube and stick to the inner walls. Figure 6 provides a references for this process.
|
| Figure 6: Capillary tubes use capillary action to pull up liquid. |
10. Allow the spot to dry, and re-spot the analyte in the exact same area as done in Step 9. Repeat this process at least five times, or until the colored dots appear distinct on the paper.
11. Pour the deionized water (your eluting solvent) into the 600 mL beaker until it has reached a height of approximately 0.5 cm. This will take approximately 20 - 30 mL.
12. Place the paper (line-side down) into the 600 mL beaker with the eluting solvent for 3 - 5 minutes. Your initial line should be above the solvent. When complete, the original spots near the bottom of the paper should be dissolved (as the colors traveled up the solvent front).
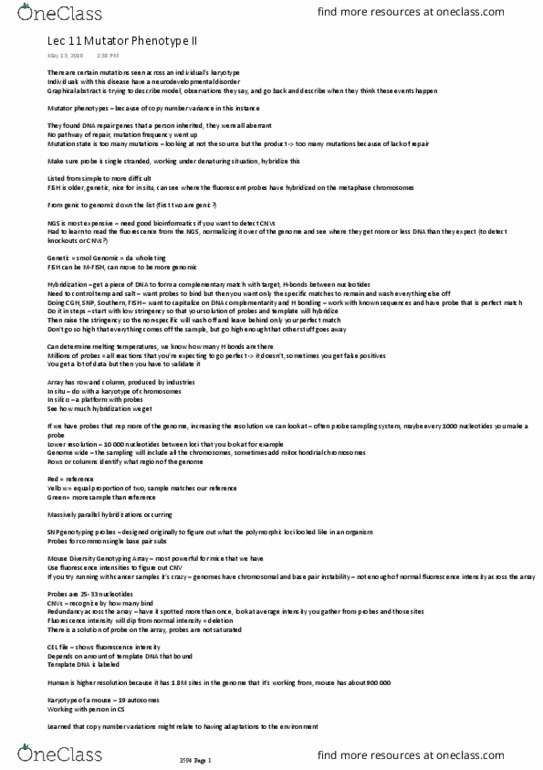
13. Mark the edge of the solvent front (the edge of the mobile phase) and the location of the analytes with a pencil (see Figure 7 for reference). Record your data and any additional observations in Table 1.
Note: Some M&Ms® colors may have more than one spot. The distance travelled by each spot should be measured and recorded.
14. Repeat the procedure five more times, incorporating one of the remaining eluting solvents (0.5% NaCl, 0.2% NaCl, 70% isopropyl alcohol, and the two solvents that you create) each time.
|
| Figure 7: Sample paper chromatography results. |
| Table 1: Experiment 1 Variables |
| Solvent | Distance Traveled by
Mobile Phase (mm) | Distance Traveled by
Each Analyte (mm) | Additional Observations |
| 1. Distilled Water | | Green:
Blue:
Red: | |
| 2. 0.5% NaCl Solution | | Green:
Blue:
Red: | |
| 3. 0.2% NaCl Solution | | Green:
Blue:
Red: | |
| 4. 70% Isopropyl Alcohol | | Green:
Blue:
Red: | |
| 5. Student Creation: | | Green:
Blue:
Red: | |
| 6. Student Creation | | Green:
Blue:
Red: |
Experiment 2: Slime Time
Although you may not realize it, the inks which are used in writing utensils are chemical solutions which include different molecules. Some inks are polar, while others are non-polar. A polar solvent will attract polar inks, while a non-polar solvent will attract non-polar inks. In this experiment, you will use inks to identify slime and silly putty as polar or non-polar. You will also use paper chromatography to verify the inks are correctly identified as polar or non-polar.
| Materials (1) 250 mL Beaker
5 mL 4% Borax Solution, Na2B4O7.10H2O
Dry Erase Marker
(1) 10 mL Graduated Cylinder
(1) 100 mL Graduated Cylinder
Filter Paper (Disk)
Filter Paper (Rectangular)
0.5 g Guar Gum
Highlighter
Permanent Marker | 1 Popsicle Stick
Silly Putty®
Ruler
Stir Rod
Uni-ball® Roller Pen
*Distilled or Tap Water
*Newspaper
*Notebook Paper
*Scissors
*You must provide |
Procedure:
Part 1: Making Slime
1. Transfer the 0.5 g of guar gum into an empty 250 mL beaker.
2. Use the 100 mL graduated cylinder to measure and pour 50.0 mL of distilled water into the 250 mL beaker with the guar gum.
3. Use the stir rod to thoroughly mix the solution.
Note: It may take a few minutes to fully dissolve the guar gum in the water.
4. Use the 10 mL graduated cylinder to measure and pour four mL of the 4% borax solution into the 250 mL beaker with the guar gum solution.
5. Use the stir rod to stir the solution until it forms a slime. This will take a few minutes. If the solution remains too runny, add an additional one mL of the 4% borax solution. Continue to stir until the solution is the right consistency.
6. Once you are satisfied with the slime's consistency, use the popsicle stick to carefully transfer it from the beaker into your hands. Be sure not to drop any of it on to the floor!
7. Manipulate the slime in your hands. When you are done, write down observations about how slime pours, stretches, breaks, feels, etc. in the Data: Part 1 section at the end of the procedure.
Caution: Slime is slippery and if dropped it can make the work area slick.
8. Transfer the slime back into the beaker and wash your hands.
Part 2: Slime and Putty Ink Tests
1. On a piece of notebook paper make one, 20 - 25 mm long mark of each of the inks you are testing. Space the marks at least one inch apart. Use a pencil to label each mark with the name of the ink source.
a. Water soluble inks include those in highlighters and certain pens.
b. Water insoluble inks include those in a permanent pen/markers, newsprint, and a Dry Erase markers.
2. While the inks are drying, select a passage or a picture in the newspaper to test with the slime.
3. Break off a small piece that is 3 - 5 cm in diameter of slime. Gently place this piece on top of the newspaper print, then carefully pick it up again.
4. Observe and record in Table 2 whether or not the ink was picked up onto the slime.
5. Break off another small piece of slime. Once the inks from Step 1 have dried, gently place the slime on top of the first spot on the notebook paper, then carefully pick it up.
6. Repeat Step 5 for each of the inks. Observe and record which inks were picked up (dissolved) by the slime in Table 2.
7. Repeat Step 6 ink testing two more times for accuracy.
8. Before performing ink tests on Silly Putty®, in the Data: Part 2 section hypothesize which inks the silly putty will pick up.
9. Perform ink tests on Silly Putty® in the same manner as above. Record your results in Table 2.
Part 3: Chromatography of Ink Samples
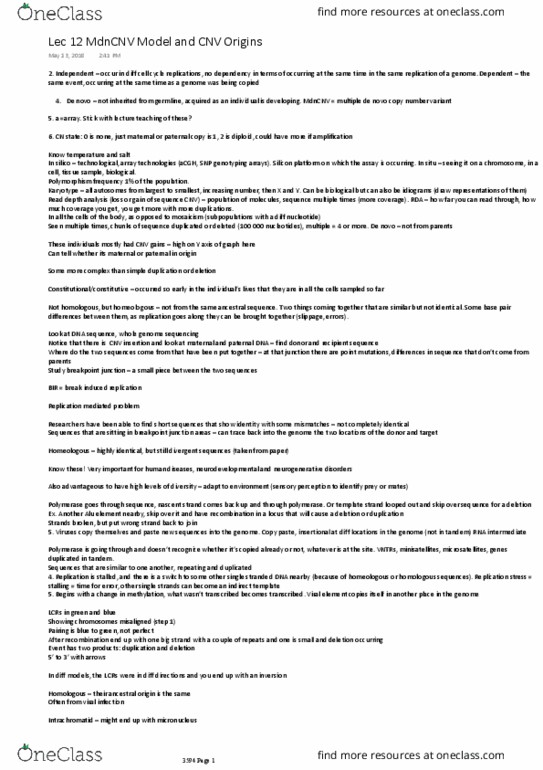
1. Use a pencil or scissors to poke a small hole in the center of a piece of filter paper disk (see Figure 8).
|
| Figure 8: Chromatography apparatus for Procedure Part 3. |
2. Use a rule to spot the filter paper with the two soluble ink sources, and the two insoluble ink sources used in Part 2 (four total). Each spot should be approximately two cm from the center hole, and should be evenly positioned around the circumference of the hole.
3. Cut the rectangular piece of filter paper in half. Fold the paper in half (length-wise) several times to create a narrow wick.
4. Insert the wick into the hole of the filter paper disk so that it the top of the wick is approximately two cm from the disk.
5. Fill a 250 mL beaker 3/4 full with water (between 100 and 150 mL of water).
6. Set the filter paper disk on top of the beaker so that the bottom of the wick is submerged in the water. The disk should extend passed the circumference of the beaker with the spotted side facing up.
7. Allow water to travel up the wick until it is approximately one cm from filter paper disk. Remove the filter paper set-up from the beaker.
8. Observe which inks moved from where they were originally spotted. Record your observations in the Data: Part 3 section at the end of the procedure.
Data
Part 1
⢠Slime Observations:
Part 2
⢠Hypothesis for Silly Putty® (Procedure Part 2, Step 7) :
Part 3
⢠Observations of inks following chromatography:
| Table 2: Results of Ink Testing for Silly Putty® |
| Name of Ink | Picked up (dissolved) | Did not pick up |
| Test 1 | Test 2 | Test 3 | Test 1 | Test 2 | Test 3 |
| Newsprint | | | | | | |
| Highlighter | | | | | | |
| Uni-ball® Roller Pen | | | | | | |
| Sharpie® Marker | | | | | | |
| Dry Erase Marker | | | | | | |
Post-Lab Question
1. Did the slime pick up water soluble or water insoluble inks in Part 2? From these results, what can you conclude about the polarity of slime molecules?
2. Explain how you determined your hypothesis about whether or not Silly Putty® would pick up water soluble inks. What scientific information did you incorporate to formulate the hypothesis? Was your hypothesis correct?
3. Were the inks you used properly classified as soluble and insoluble? Explain your answer.