Biology 2244A/B Lecture Notes - Lecture 6: Statistical Inference, Probability Distribution, Standard Deviation

1 Jan 2017
School
Department
Course
Professor

Document Summary
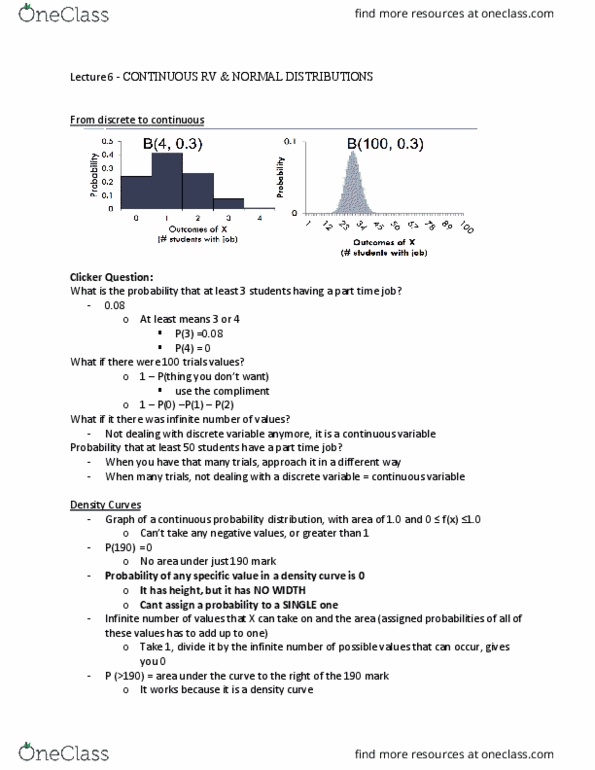
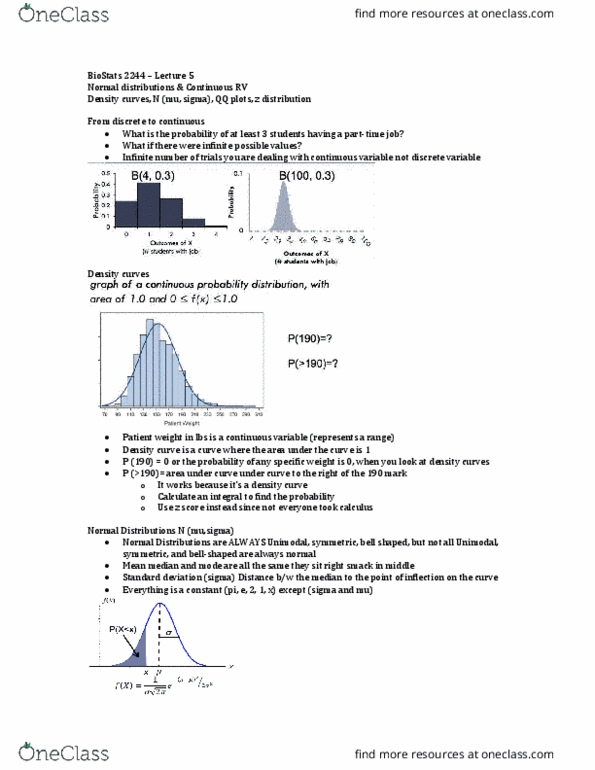
Lecture 6 continuous rv & normal distributions. At least 3 is 3 or 4: 3 is under 0. 8 and 4 is close to 0. 1 probability of things you don"t want: use the compliment. When have that many trials, approach it in a different. When many trials, not dealing with a discrete variable = continuous variable. Infinite number of possible values that weight can take on. Density histogram: area of bars = 1. Weight in pounds is a continuous variable: example: 150 pounds = 149. 5 150. 4. Graph of a continuous probability distribution with area of 1. 0 and 0 f(cid:523)x(cid:524) (cid:883). (cid:882) Density histogram doesn"t properly describe density relationship of patient weight. Can"t take negative values of values greater than (cid:883: like density histogram but using the area under the curve, apply this when we have continuous variables (height, weight) 0: not reflective of a continuous variable because there are blocks.