Biology 2244A/B Lecture Notes - Lecture 7: Confounding, Confidence Interval, Sampling Distribution

28 Feb 2017
School
Department
Course
Professor
Document Summary
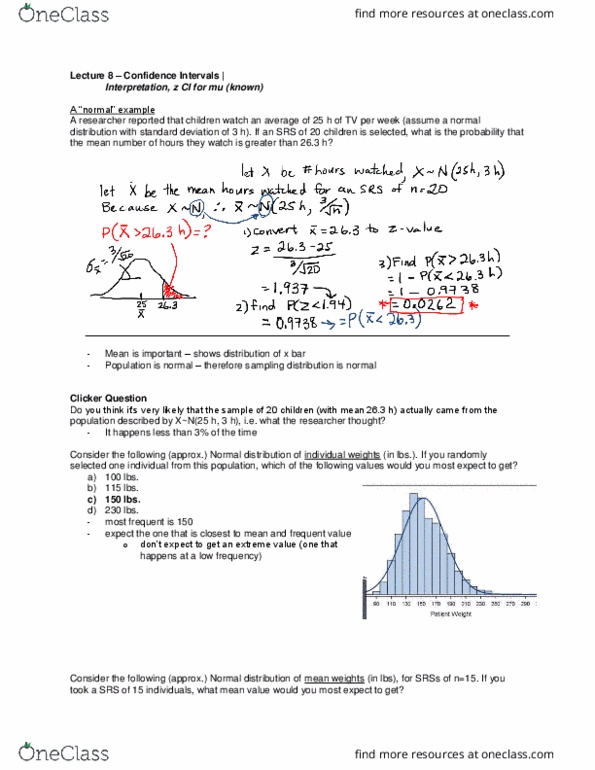
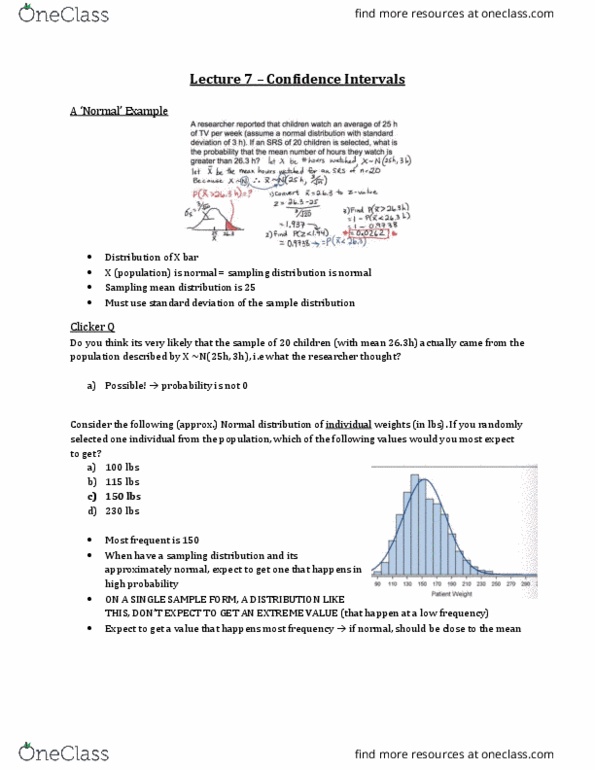
If population is normal then the sample distribution should be normal c) 150 lbs. You expect to get one of the values that occur frequently and if it"s a normal distribution you expect to to be close to the mean. Single sample don"t expect to get the extreme values (happen barely) Z distribution gives us everything to the left so use z distribution find closest number to 0. 025 to find the z score wise. cgu. edu/portfolio/demo-confidence-interval-creation/ it"s a bad interval if it doesn"t cross the mean. 95% of the intervals you construct will capture the real mean. Assuming sampling dis is normal that way we know 95% of them fall within the mean. Trying to estimate the pop mean mu. X bar is a point estimate single estimate of what mu is: problem: many x bar values. Sd tells us how far a value is from the mean gives us a typical value of the sampling error.