Biology 2244A/B Lecture Notes - Lecture 7: Standard Deviation, Normal Distribution, Statistical Inference

12 Dec 2017
School
Department
Course
Professor
Document Summary
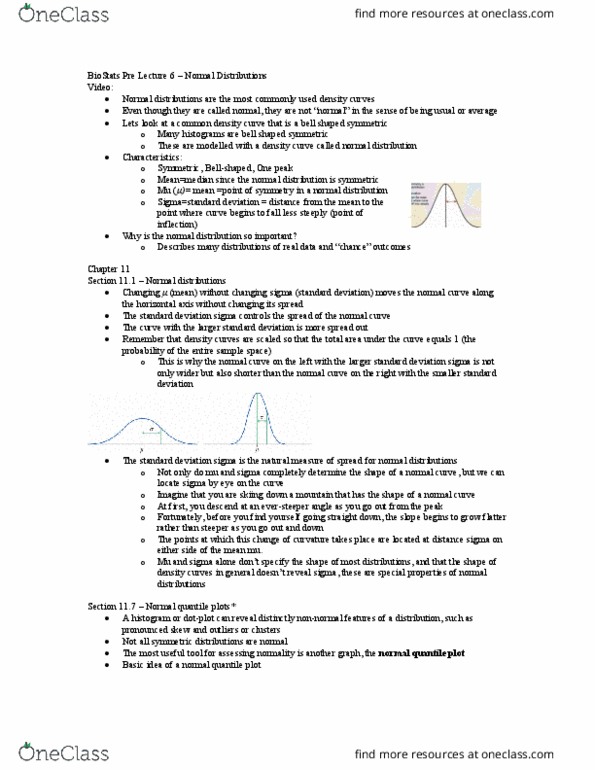
Type of density curve (area underneath must always =1) Not typical, need to plot before assuming it is normal. Distance from mean to point where curve begins to fall less steeply (point of inflection) Almost all observations fall between -3sigma and +3sigma. 68% of observations fall within 1 standard deviation of the mean. 95% of observation fall within 2 standard deviations of the mean. 99. 7% of observations fall within 3 standard deviations of the mean. Changing mu without changing sigma: moves curve along horizontal axis, not changing spread. Standard normal distribution: a normal distribution with mean=0 and sd=1. To verify that a curve is in fact normal. To find: arrange data from smallest to largest, then find what percentile each value occupies, find z-scores at these percentiles, plot each data point (x) against the z-scores. If data is normal: data points will be close to the 45 degree line x=z.