Health Sciences 3801A/B Lecture Notes - Lecture 6: Scatter Plot, Effect Size, Statistical Significance

12 Apr 2021
School
Department
Course
Professor
Document Summary
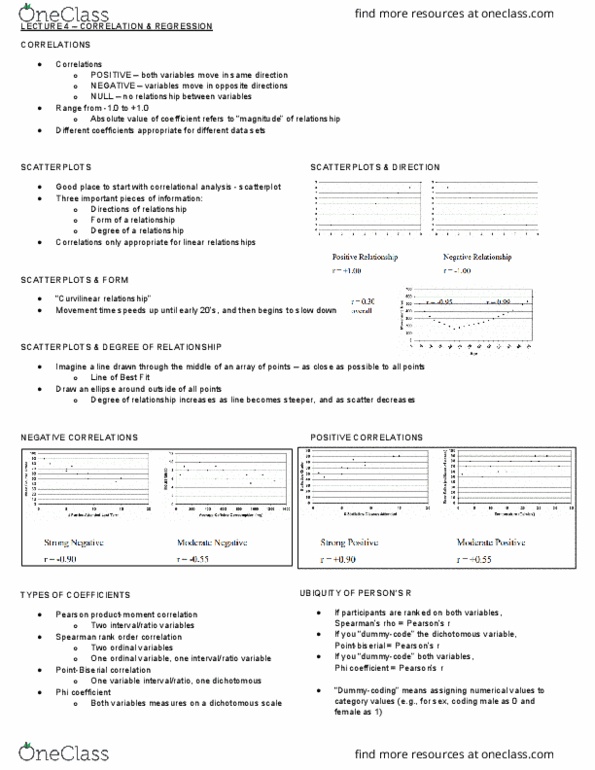
Scatterplots: best to start with a scatterplot whenever possible, 3 important pieces of information, direction of relationship, form of a relationship, degree of a relationship, correlations only appropriate for linear relationships. Association, relationship, or correlation: association = any relationship between variables, correlation = a linear relationship between variables, can be parametric or non-parametric, can be multivariate, most likely to see bivariate, meaning that they are correlations between. 2 variables: can be between continuous or categorical variables. If the participants are ranked on both variables, spearman"s rho = pearson"s r. If you dummy-code the dichotomous variable, point biserial = pearson"s r: dummy-coding means assigning numerical values to category values, e. g. , for sex, coding male as 0, female as 1 . If you dummy-code both variables, phi coefficient = pearson"s r. Assumptions for pearson"s r: linear relationship, bivariate normality. Interval/ratio measurement: homoscedasticity, sd(y) is equal for each value of x. Independent residuals: the assumption that errors are uncorrelated.