Psychology 1000 Lecture Notes - Lecture 11: Standard Score, Standard Deviation, Frequency Distribution

8 Mar 2016
School
Department
Course
Professor


111
PSYCH 1000 Full Course Notes
Verified Note
111 documents
Document Summary
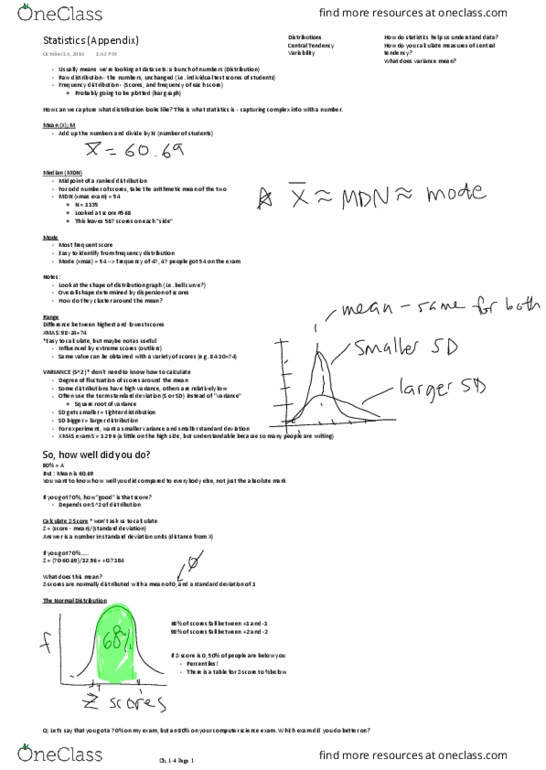
Frequency distribution how many times the particular number was achieved. If mean median mode are similar or equal, overall shape can be determined by dispersion. Mean (xbar); m add up numbers and divide by n (total number) Same value can be obtained with a variety of scores. Degree of fluctuation of scores around the mean. Some distribution have high variance, others are relatively low. Z = (score mean) / standard deviation. Z-scores are normally distributed with a mean of 0 and s=1. 96% distributed between -2 and +2 (14% from 1 sd) Simplify by looking at frequency, mean, median, mode. Shape influenced by spread of range and variance.