Statistical Sciences 1023A/B Lecture Notes - Lecture 14: Dependent And Independent Variables, Scatter Plot, Lincoln Near-Earth Asteroid Research

31 Aug 2016
School
Department
Professor
Document Summary
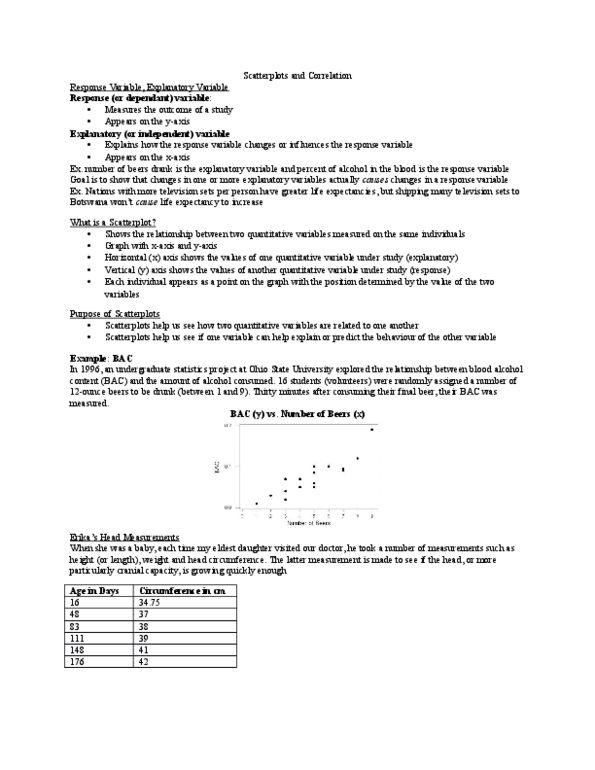
Relationship b/w bac and amount of beer ingested. Meaningful 0 + can use 2 other pieces of data to compare and have a meaningful rat. Linear relationship - one thing increases so does the other. Measures strength + direction of linear relationship b/w 2 quantitative variables. R as a descriptor -1 (less than or equal to) to +1 (less than or equal to) Doesn"t matter which variable is x versus y. Correlation looks at how they respond to one another. On average women marry men 9cm taller than them. T/f: this means that the correlation b/w the heights of spouses in negative. Model assuming a linear relationship b/w response variable + explanatory variable. Trying to get through as many points as possible. Line that minimizes sum of squared vertical distances of data points from the line. Tries to minimize the sum of those distances. Distance below the line (-ve distances), distance above the line (+ve)