Statistical Sciences 1024A/B Lecture Notes - Lecture 3: Interquartile Range, Random Variable, Standard Deviation

19 Oct 2016
School
Department
Professor
Document Summary
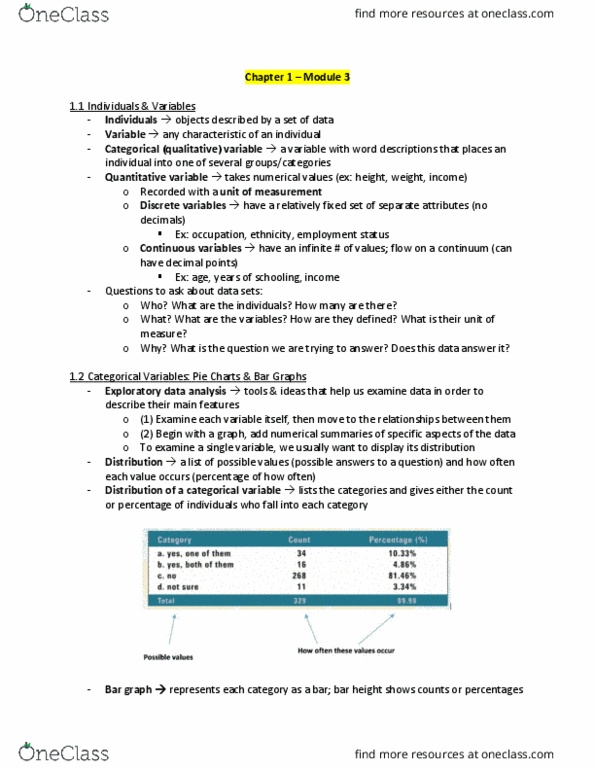
Take a sample, and measure and record information (i. e. , data) on all variable(s) for the units in the study. To choose an appropriate graphical or numerical summary, we rst need to identify the type of data we have. Pie charts and bar graphs are appropriate for qualitative data. Histograms, boxplots, and stemplots are appropriate for quantitative data. However, we lose sight of the original data when we use histograms and box plots. Stemplots, on the other hand, are built using the data values but become tedious to. Thursday, may 28, 2015 construct when we have lots of data. Important feature of a quantitative variable distribution: shape: distribution is symmetric if the right and left sides are mirror images of one another, if one side extends farther than the other, the distribution is called skewed. Skewed to the left if the left side of the histogram extends out more than the right.