Statistical Sciences 2244A/B Lecture 8: Lecture 008

15 Jan 2017
School
Department
Professor
Document Summary
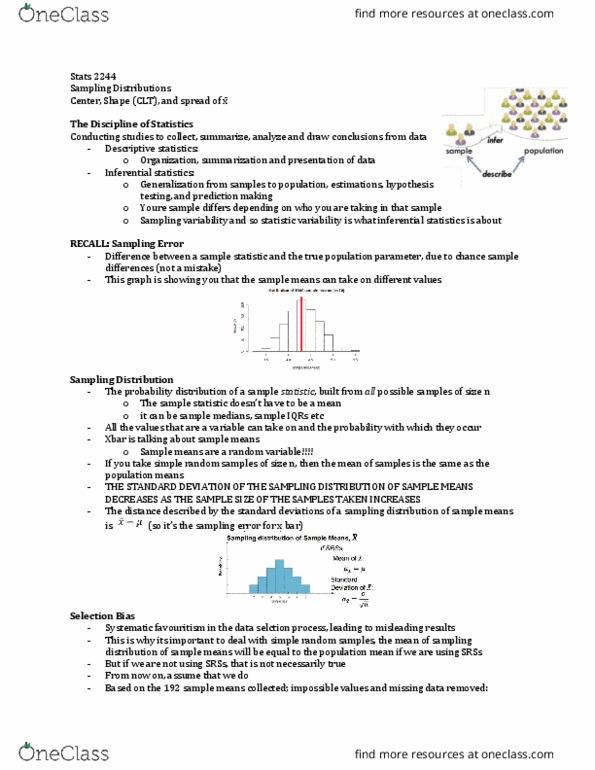
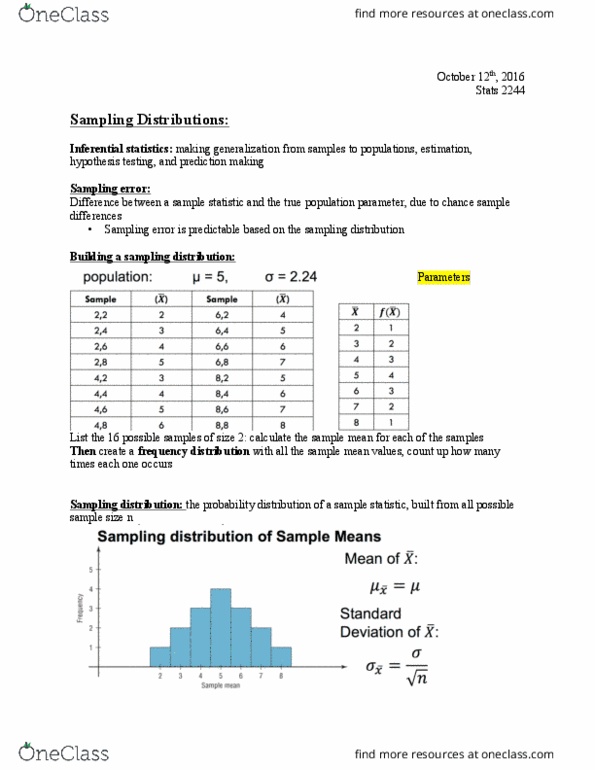
Use information from the sample to make generalizations about the population. Difference between a sample statistic and the true population parameter, due to chance sample differences. An 8 question test is administered to 4 students. The marks for the test were 2, 4, 6, 8. Population : = 5, = 2. 24. Sample (x-bar) (2,2) (2,4) (2,6) (2,8) (4,2) (4,4) (4,6) (4,8) The probability distribution of sample statistic, built from all possible samples of size n. The mean of the sample means, is equal to the population mean. Only true if an srs was used. Thus if you sample in a good manner, the amount of variation in the sample will be known. If the sample size is large enough, the distribution of sample means can be approximated by a normal distribution. Considering a random variable, x, with mean and standard deviation . Judge the normality of the population by the normality of the sample data.