Statistical Sciences 2244A/B Lecture 13: Correlation

13 Apr 2018
School
Department
Professor
Document Summary
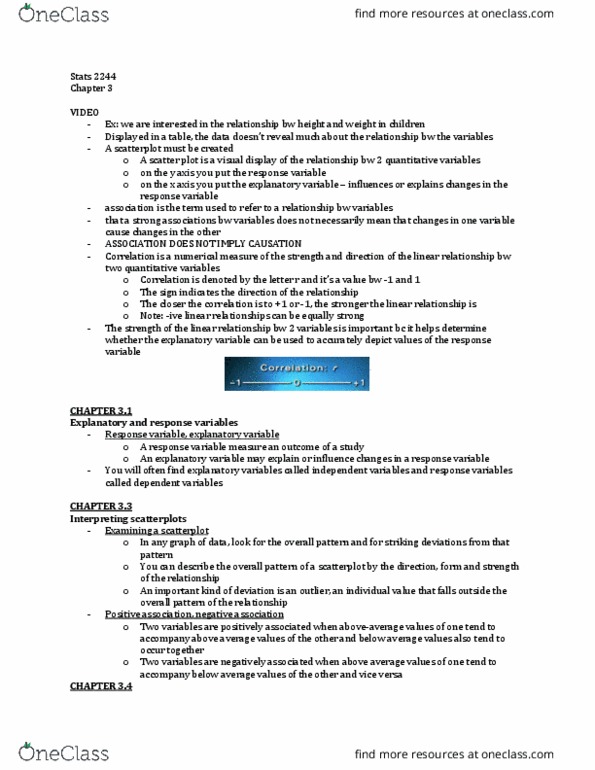
Correlation vertical axis: response variable horizontal axis: explanatory variable; in uences or explains the response variable. Correlation close to 1 or -1 is stronger. Correlation close to 0 is weak or nonlinear. Helps to determine if the explanatory variable is a reasonable measure that can be used to predict a response. Rst describe the direction of a scatterplot, then the form, then the strength. Correlation makes no distinction between explanatory and response variables (makes no. R uses standardized values so when the units of measurements change, r does not because r. R = -1 or 1 only when there is a perfect linear relationship. R value close 0 indicates a weak relationship. Correlation requires both variables to be quantitative they are (only measures strength of linear relationships) Correlation does not describe curved relationships between variables, no matter how strong. Correlation is not resistant (like mean and standard deviation); it is a ected by outliers.