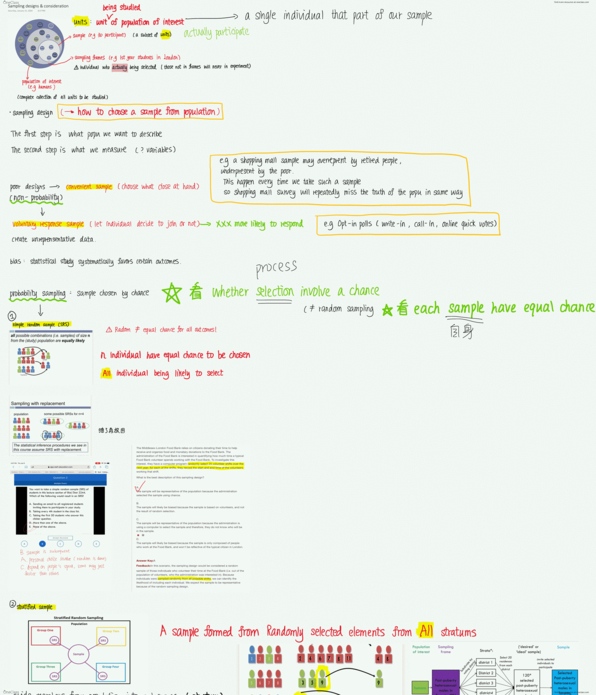
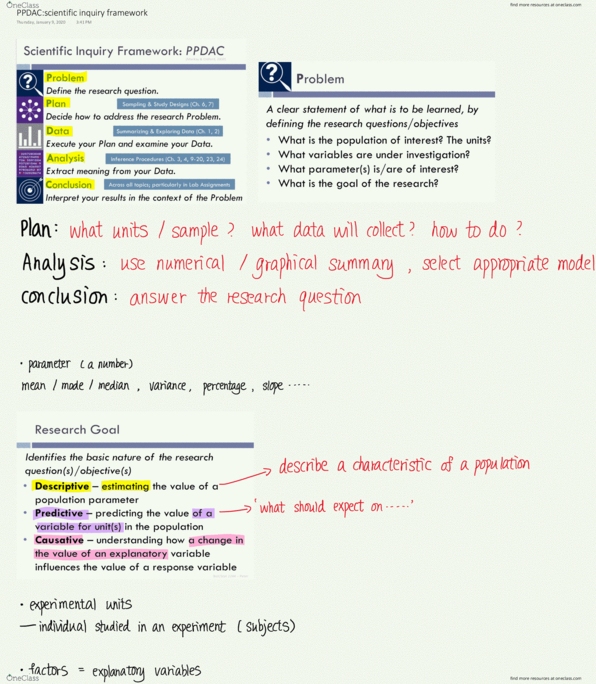
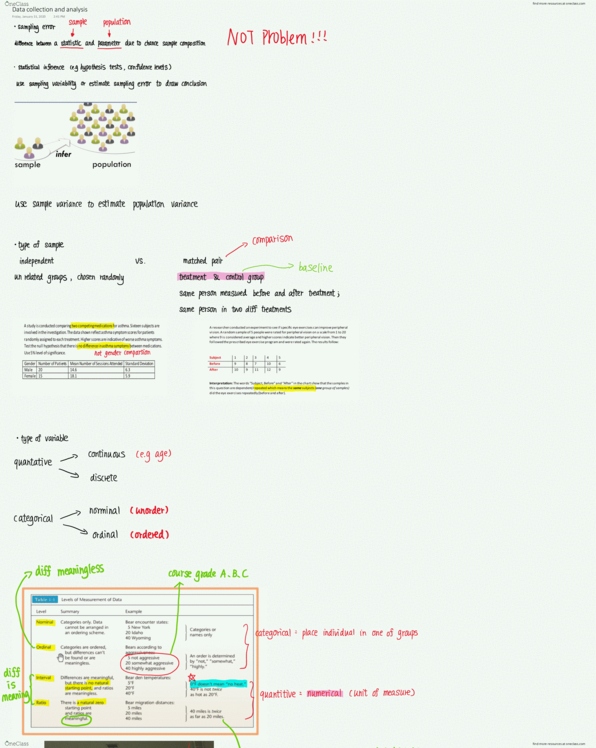
Statistical Sciences 2244A/B Lecture 18: Study design

Get access


Related Documents
Related Questions
Hypothesis testing with ANOVA opinions about whether caffeine enhances test performance differ. You design a study to test the impact of drinks with different caffeine contents on students' test-taking abilities. You choose 21 students at random from your introductory psychology course to participate in your study. You randomly assign each student to one of three drinks, each with a different caffeine concentration, such that there are seven students assigned to each drink. You then give each of them a plain capsule containing the precise quantity of caffeine that would be consumed in their designated drink and have them take an arithmetic test 15 minutes later.
The students receive the following arithmetic test scores:
| Cola | Black Tea | Coffee | ||
| Caffeine Content (mg/oz) | 2.9 | 5.9 | 13.4 | |
| 85 | 85 | 92 | ∑X2 = 147,641 | |
| 86 | 89 | 87 | G = 1,755 | |
| 82 | 82 | 80 | N = 21 | |
| 75 | 75 | 89 | k = 3 | |
| 66 | 88 | 96 | ||
| 78 | 76 | 83 | ||
| 87 | 82 | 92 | ||
| T1 = 559 | T2 = 559 | T3 = 559 | ||
| SS1 = 338.86 | SS2 = 338.86 | SS3 = 338.86 | ||
| n1 = 7 | n2 = 7 | n3 = 7 | ||
| M1 = 79.8571 | M2 = 79.8571 | M3 = 79.8571 |
1.) You plan to use an ANOVA to test the impact of drinks with different caffeine contents on students' test-taking abilities. What is the null hypothesis?
(a) The population mean test score for the cola population is different from the population mean test score for the black tea population.
(b) The population mean test scores for all three treatments are equal.
(c) The population mean test scores for all three treatments are different.
(d) The population mean test scores for all three treatments are not all equal.
2.) Calculate the degrees of freedom and the variances for the following ANOVA table:
| Source | SS | df | MS |
| Between | - | - | - |
| Within | 702.28 | - | - |
| Total | 973.14 | - |
The formula for the F-ratio is:

3.) Using words, the formula of the F-ratio can be written as:

4.) Using the data from the ANOVA table given, the F-ratio can be written as:

5.) Calculate for F-ratio:

6.) At the 
(a)You can reject the null hypothesis; you do not have enough evidence to say that caffeine affects test performance.
(b)You cannot reject the null hypothesis; caffeine does appear to affect test performance.
(c)You cannot reject the null hypothesis; you do not have enough evidence to say that caffeine affects test performance.
(d)You can reject the null hypothesis; caffeine does appear to affect test performance.

APLIA STATISTICS
The results of the study are presented in the following data table. All scores are times necessary to complete the paper folding-task, recorded in seconds.
Noise Type
| Participant | Classical Music | White Noise | Nature Sounds | Participant Totals | |
| A | 3.22 | 3.42 | 3.46 | P=10.10 | n= 5 |
| B | 3.27 | 3.31 | 3.35 | P=9.93 | k=3 |
| C | 3.47 | 3.93 | 3.69 | P=11.09 | N=15 |
| D | 3.43 | 3.91 | 3.74 | P=11.08 | G=53.33 |
| E | 3.35 | 4.16 | 3.82 | P=11.33 |
 |
| T = 16.74 | T = 18.73 | T = 18.06 | |||
| SS = 0.0441 | SS = 0.5286 | S = 0.1575 |
The three treatments in the experiment define three populations of interest. You use an ANOVA to test the hypothesis that the three population means are equal. Present the results of your analysis in the following ANOVA table by entering the missing df values df and selecting the correct values for the missing SS, MS and F entries. (Note: For best results, retain at least two additional points throughout your calculations. Depending on the order in which you do these calculations and the number of digits you retain, you may find slight rounding differences in the last digit between your answers and the answer choices"
ANOVA
| Source | SS | df | MS | F |
| Between treatments | ||||
| Within treatments | 0.0609 | |||
| Between subjects | 0.1372 | |||
| Error | ||||
| Total | 14 |
