Statistical Sciences 2244A/B Lecture Notes - Lecture 3: Box Plot, Interquartile Range, Quartile

9 Feb 2016
School
Department
Professor
Document Summary
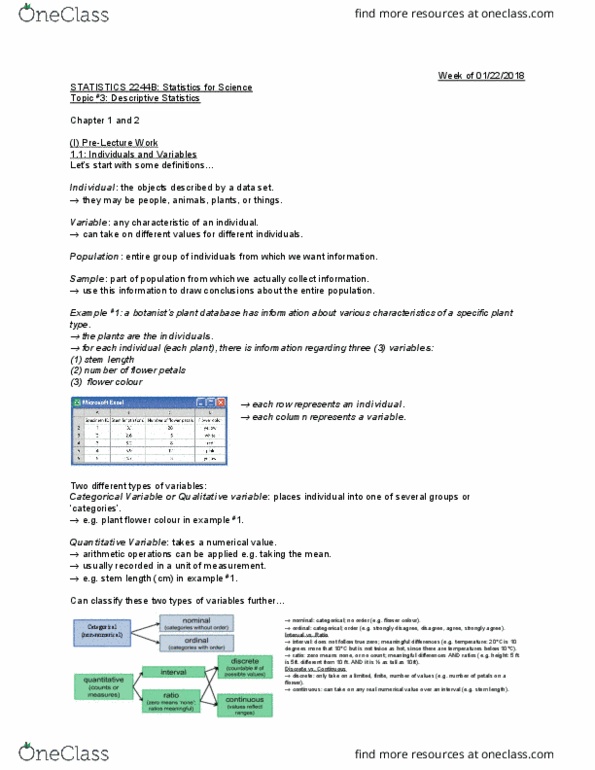
Individuals= objects described by a set of data. Spreadsheet = row(to on individual) and column( to a variable) Categorical variable = places an individual into one of several groups/categories (qualitative) Ordinal = can be ranked, altho intervals btwn consecutive ranks are often not identical. Quantitative variable = takes numerical values in a unit of measurement (able to perform arithmetic functions like adding/averaging) Continuous = variables can take any real numerical value over an interval. Discrete = can only take a limited, inite number of values. Median = m = midpoint of a distribution. Arrange all observations in order of size => (n+1)/2. Odd: median is the center value in the list. Even: median is the mean of the two center values in the list. Spread/ variability of a set of data, resistant to ouliers. Irst quartile = one quarter (25%) of the observations. Third quartile = 75% of the observations. Ive number summary of a distribution = minimum, q1, m,q3,maximum.