KP290 Lecture Notes - Lecture 7: Standard Deviation, Statistical Parameter, Statistical Hypothesis Testing

25 Oct 2018
School
Department
Course
Professor
Document Summary
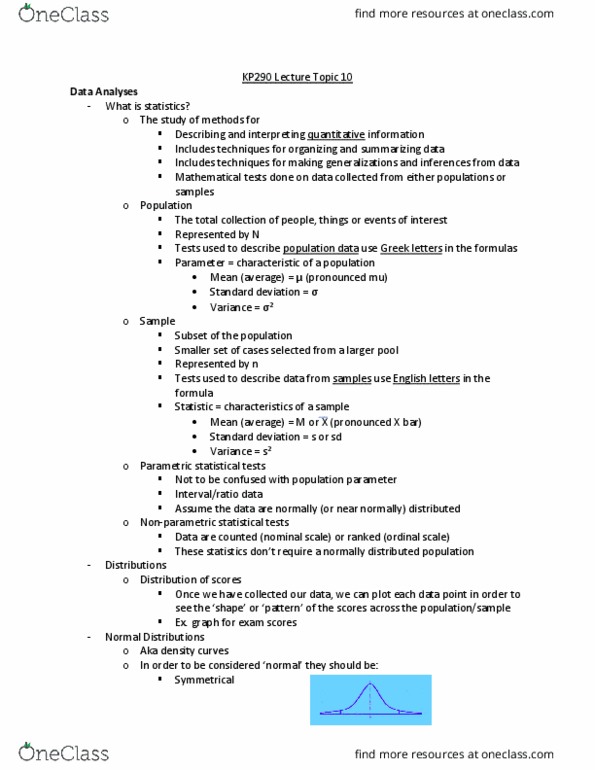
Includes techniques fro organizing and summarizing data. Includes techniques for making generalization and inferences from data. The total collection of people, things, or events of interest. Smaller set of cases selected from a larger pool. Trests used to describe population data us greek letter in the formulas. Tests used to describe data from samples used english letter in the formula. Mean (average): m or (pronounced x bar) Not to be confused with population parameter. Assume the data are normally (or near normally distributed) Data are counted (nominal scale) or ranked (ordinal scale) These statistics do not require a normally distributed. Once we have collected our data, we can plot each data point in order to see the. Shape or patter of the scores across the population or sample. In order to be considered normal they should be. Normal distributions will have the same overall shape.