PO218 Lecture Notes - Lecture 14: Chi-Squared Distribution, Contingency Table, Sampling Distribution

Document Summary
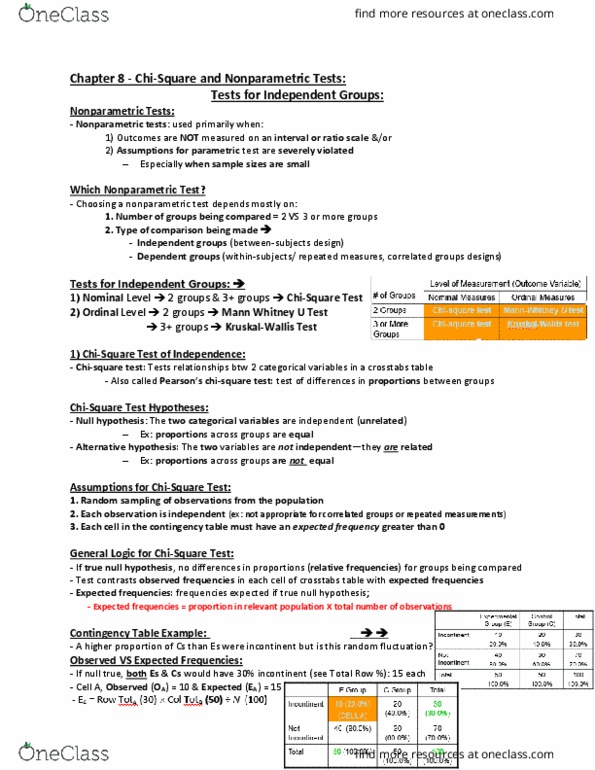
Step 3: select sampling distribution and establish the critical region sampling distribution= x2 alpha= . 05 df= (r-1)(c-1)=1 x 2 (critical)= 3. 841. Interpreting chi square should all up downwards to 100% this relationship has a clear pattern: people that support privatization of healthcare in. Limitation of chi square: difficult to interpret when variables have many categories. Best when variables have 4 or fewer categories: with small sample size, cannot assume that chi square sampling distribution will be accurate. Small sample: high percentage of cells have expected frequencies of 5 or less: like all tests of hypotheses, chi square is sensitive to sample size. As n increases, obtained chi square increases. With large samples, trivial relationships may be significant. Ch. 11 bivariate measures of association: nominal association between variables and the bivariate table (crosstab) three characteristics of bivariate associations chi square-based measures of association lambda: a pre measure for nominal-level variables.