PO218 Lecture Notes - Lecture 6: Statistical Inference, Standard Score, Normal Distribution

Document Summary
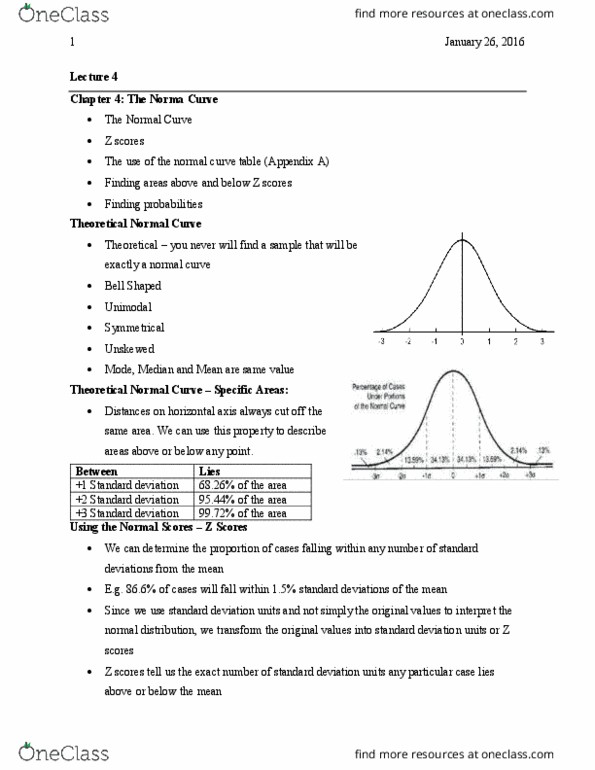
The use of the normal curve table. Finding areas above and below z scores. More cases you have, the more likely you are to approach this shape. Midpoint with half the sample falling on one side and the other half falling on the other side. Mode, media and mean are same value. Distances on horizontal axis always cut off the same area. We can use this property to describe areas above or below any point. Half are positive (greater than the mean) the other half are negative (lower than the mean) We can determine the proportion of cases falling within any number of standard deviations from the mean. 86. 6% of cases will fall within 1. 5 standard deviations of the mean. Since we use standard deviation units and not simply the original values to interpret the normal distribution, we transform the original values into standard deviation units or z-scores.