PS296 Lecture Notes - Lecture 12: Confidence Interval, Effect Size, Statistical Hypothesis Testing


WEEK 7 – LECTURE 12
PS296 / JUNE 19 2018
Overview:
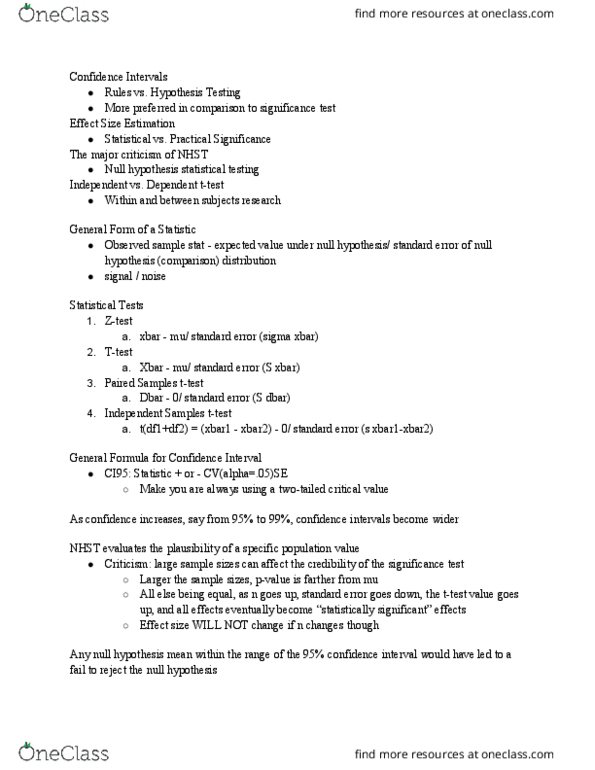
1) Confidence intervals
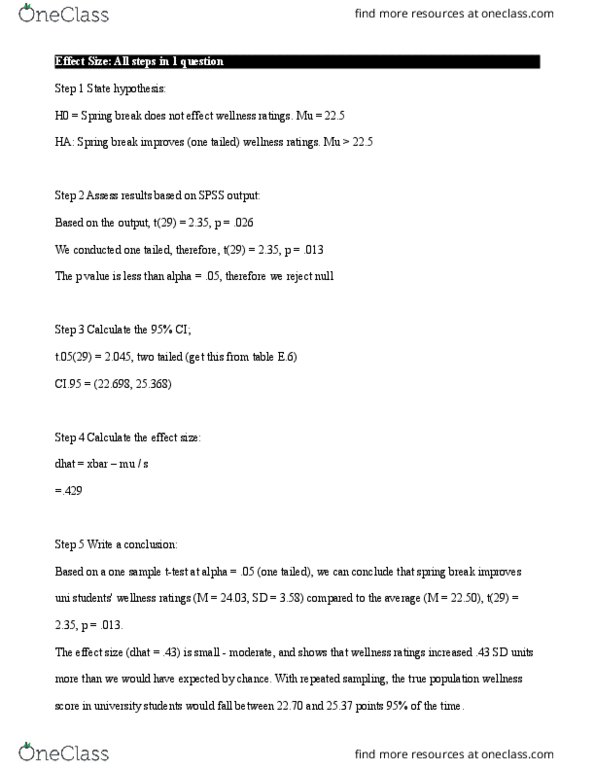
2) Effect size
3) Hypothesis testing with two sample means (related/paired samples t test)
Dancing and Anxiety HW:
N = 6
mu = 5.43
xbar – 3.83
s = .75
Did dancing successfully reduce patients' anxiety?
-SD we are provided with is from sample (not population), thus we do a t test
-t test (1 tailed)
H0: no difference. Mu = 5.45
H1: those who dance have lower anxiety. Mu < 5.43
One tailed test, t.05(5) = -2.015
-negative bc the sample mean is less than the population mean
-critical value of t = -5.229 exceeds the critical value of -2.015, therefore, reject the null
find more resources at oneclass.com
find more resources at oneclass.com
Document Summary
Overview: confidence intervals, effect size, hypothesis testing with two sample means (related/paired samples t test) N = 6 mu = 5. 43 xbar 3. 83 s = . 75. Sd we are provided with is from sample (not population), thus we do a t test. Negative bc the sample mean is less than the population mean. Critical value of t = -5. 229 exceeds the critical value of -2. 015, therefore, reject the null. Based on a one sample t-test at alpha = . 05 (1 tailed) we can conclude the patients who danced (m = 3. 83, sd = . 75) were less anxious than average (m = 5. 43), t(5) = -5. 23, p < . 05). S over the square root of n is the standard error. Spss only runs two tailed test for t, sig (2 tailed) is the actual p value. If we want to run a one tailed test, we take the spss p value for two tailed and divide it in half.