PS101 Lecture Notes - Histogram, Null Hypothesis, Statistical Significance

Document Summary
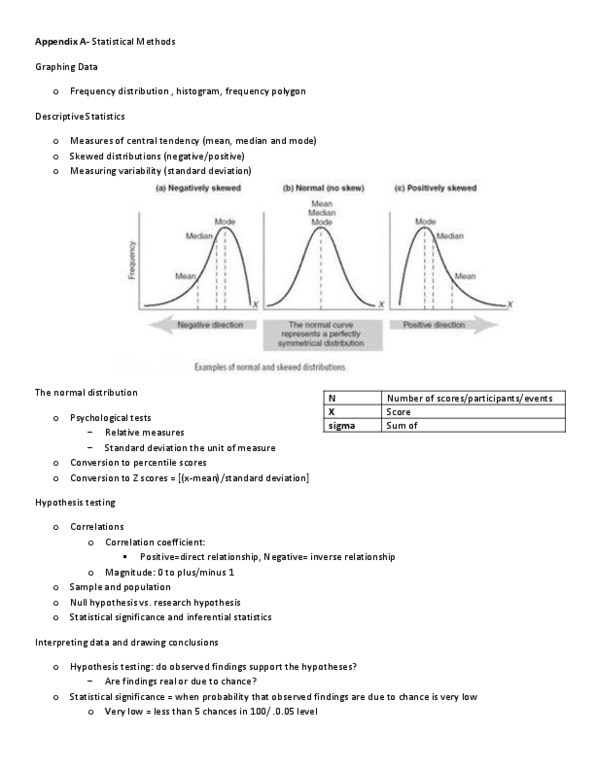
Statistics don"t lie, but humans do -> but stats can be wrong. Used to describe a situation: measures of central tendency mean, median (doesn"t have to be a number), mode. Skewed distributions: negative: when the tail leans to the left (bump is on the right, positive: when the tail leans to the right (bump is on the left) N = the number of scores/ participants/ events. (sigma) = sum of or add them up . Used in psychological tests: relative measures compared to others, uses standard deviation as the unit of measure. Conversion to z scores (z score (x-mean)/ standard deviation) Testing hypothesis there is just as high of a chance that the hypothesis will be proven wrong as right makes conclusions stronger to deny. Correlation coefficient: positive = direct relationship (not necessarily good, negative = inverse relationship. Science: set out to prove the null hypothesis correct.