BIOL 1000 Lecture Notes - Lecture 4: Pressure Measurement, Standard Deviation, Null Hypothesis

12 Mar 2019
School
Department
Course
Professor

Document Summary
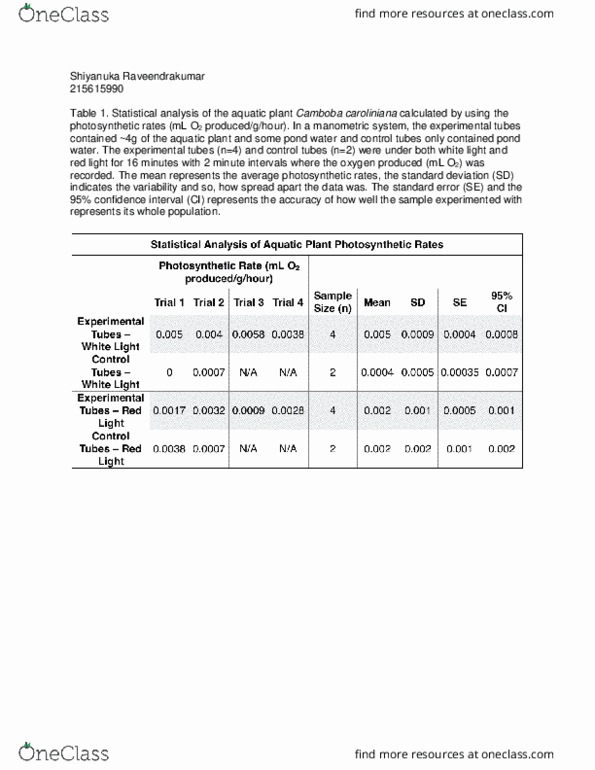
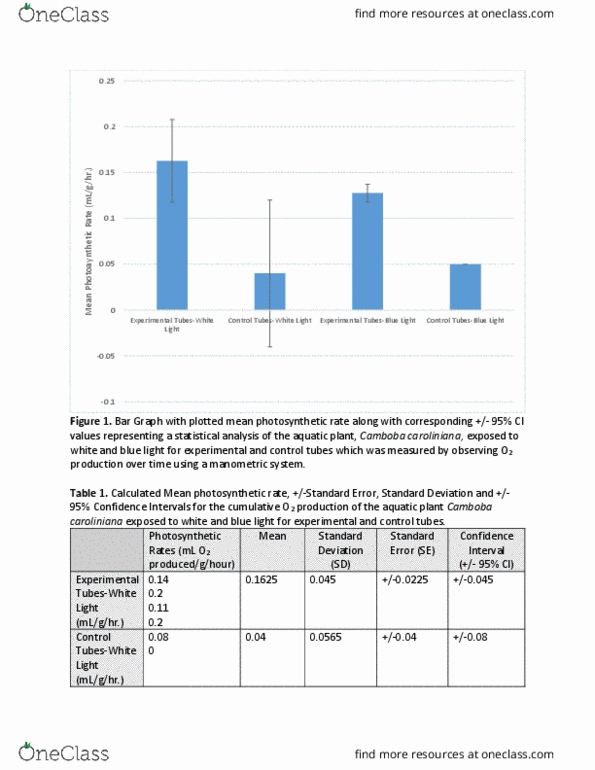
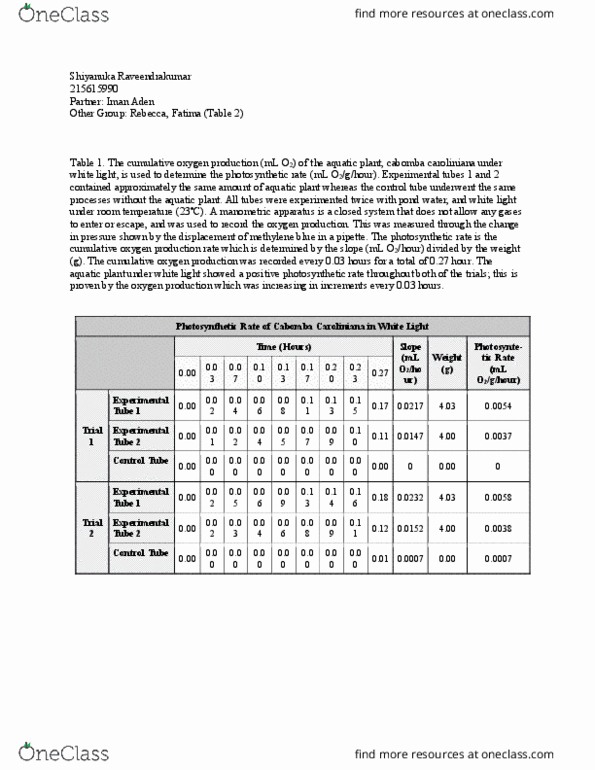
Statistical analysis of the aquatic plant camboba caroliniana calculated by using the photosynthetic rates (ml o2 produced/g/hour). In a manometric system, the experimental tubes contained ~4g of the aquatic plant and some pond water and control tubes only contained pond water. The experimental tubes (n=4) and control tubes (n=2) were under both white light and red light for 16 minutes with 2 minute intervals where the oxygen produced (ml o2) was recorded. The mean represents the average photosynthetic rates, the standard deviation (sd) indicates the variability and so, how spread apart the data was. The standard error (se) and the 95% con dence interval (ci) represents the accuracy of how well the sample experimented with represents its whole population. The bar graph shows the mean of the photosynthetic rates (ml o2/g/hour) and the. 95% con dence interval error bars associated to each mean. The error bars represent the true mean of each photosynthetic rates.