MGMT1021 Lecture Notes - Lecture 18: Gini Coefficient, Lorenz Curve, Working Poor

4 May 2016
School
Department
Course
Professor
Document Summary
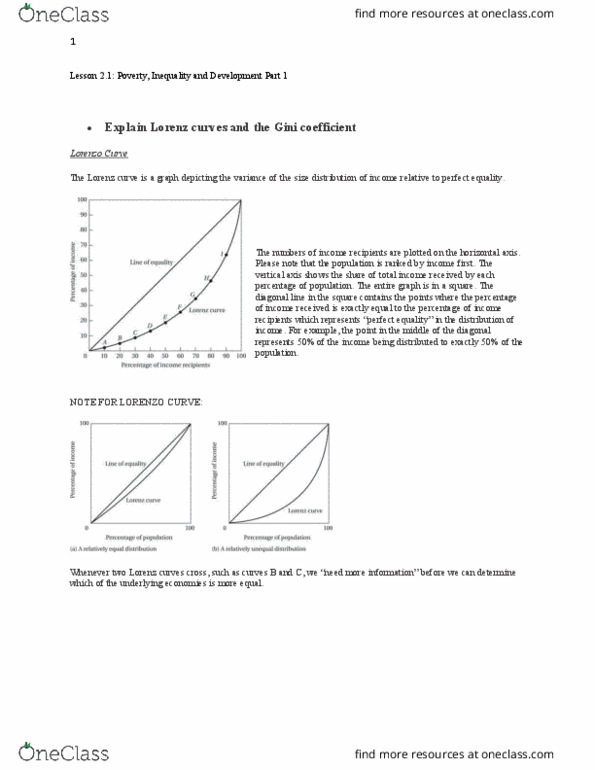
Session 18: inequality in and around organizations: the phenomenon, six heirs of the walmart fortune have a net worth equal to that of the bottom. 42% of the us population combined: a measure of inequality: the gini coefficient b. i. Measures the extent to which the distribution of income deviates from a perfectly equal distribution b. i. 1. The percentage of area that lies between the lorenz curve and a line of perfectly equality b. i. 2. Varies between 0 (perfect equality) and 1 (perfect. Inequality around organizations inequality: what causes income inequality most directly? a. i. Primarily in service jobs; fastest growing segments of economy b. i. 3. b. i. 4. Negative consequences on health, wellness, and decision making b. ii. Impact on customers: understand the organizational practices around low wage work c. i. Impact of low wage work on employees: health and well being a. i. Health outcomes (high blood pressure, life expectancies, heart attacks) linked to jobs people do (lack of) medical care: decision making b. i.