ECON 160 Lecture 3: 5 W’s and 1H Where – the location of the study When – the time the study is conducted What – the variable being measured Why – why is the study being conducted

14 Oct 2016
School
Department
Course
Professor
Document Summary
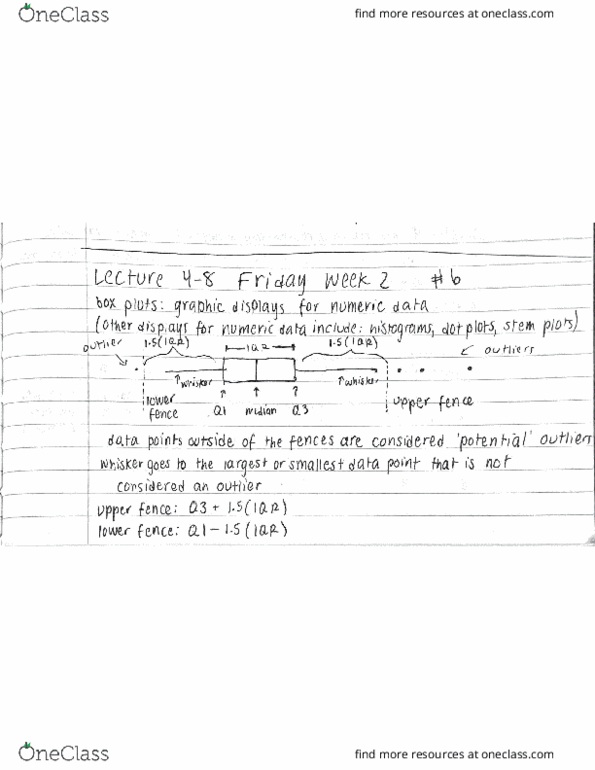
Who subjects how how was the data collected. Center median, mode, mean unusual feature shape spread the variability of the data. No decimal points in stem plot outlier an extreme value in a data set . Outlier if lower than lower fence or higher than upper fence . Lower fence (q1 1. 5 iqr) . Upper fence (q3 + 1. 5 iqr) average number in a data set that is sorted mode most frequently. Median middle observed value in a data set n sample size resistant measure a measure that is not affected by outliers min, q1(25th percentile), Med, q3(75th percentile), max iqr = q3 q1 distribution . Skewed right distribution, mean > median . Skewed left distribution, mean < median relative frequency the fraction of times a datum is observed cumulative relative frequency the accumulation of the previous relative frequencies. If the values in a data set are : increased or decreased by a constant a.