STAB22H3 Lecture Notes - Box Plot, Summary Statistics, Data Center


38
STAB22H3 Full Course Notes
Verified Note
38 documents
Document Summary
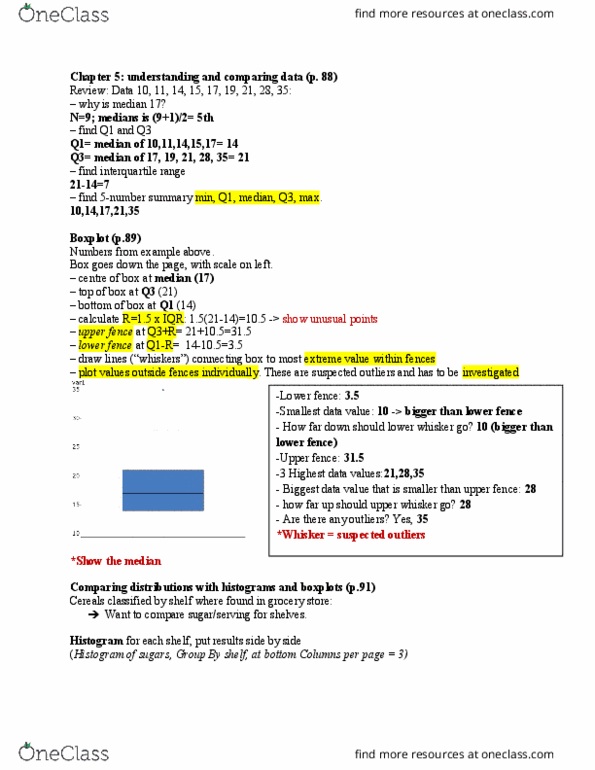
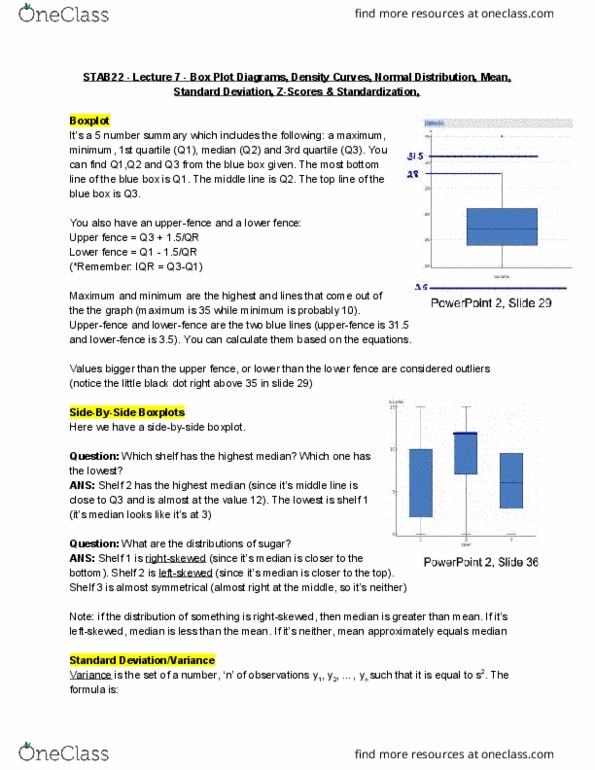
Stab22 lec04 (covers entire chapter 5, and some beginning part of chapter 6) Note - near the end of the lecture, he discusses data about potassium. Find: median = 17, q1= 14, q3 = 21, iqr = q3 - q1 = 21 - 14 = 7, max = 35, min = 10. Gives min, q1, median, q3 and max: Summarizes the extremes, and the percentiles (25th, 75th, 50th) => capable of summarizing large quantity of #"s w/ small quantity of summary val"s (only 5) Visual display retireved from using the following statistical summaries: Median, q3, q1, min, max, upper fence, lower fence, and iqr. => incorporates 5-number summary in a visual display. These are imaginary horizontal lines at particular values. Note - he expressed r to equal (1. 5)(iqr). So, we can alternatively write the uf, lf formulae as follows: Draw vertical lines protruding from box of boxplot to most extreme value within the.