CAS MA 113 Lecture Notes - Lecture 4: Central Tendency, Standard Deviation, Variance

18 Oct 2016
School
Department
Course
Professor
Document Summary
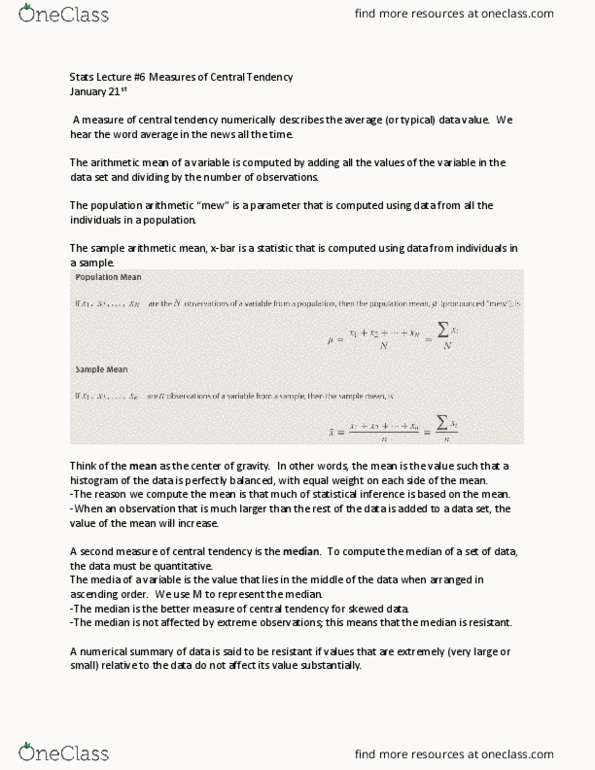
Numerically summarizing data: measure of central tendency. Formula = sum of all things/ total number of. Median: value of a variable that lies in the middle when data is in as(cid:272)ending order, median doesn"t have to (cid:271)e in the data set. Mode: the value that occurs most frequently in a data set. Measures of dispersion: range: largest value- smallest value, standard deviation: (imp) Population standard deviation sigma (refer to yellow notes for formulas: variance. The fatter the graph depends on fatter; more the dispersion in data the fatter it will get and vice cersa. Variance/ standard deviation cannot be negative or less than 0. Bell curve empirical rule: 68% 95% 99. 7% Mew + sigma = 68% of the data will fall in this. Mew sigma = 68% of the data will fall in this. Mew + 2sigma= 95% of the data will fall in this. Mew- 2sigma = 95% of the data will fall in this.