CAS MA 113 Lecture 10: Computing, Graphing and Tabulating Standard Deviation

12 Feb 2018
School
Department
Course
Professor
Document Summary
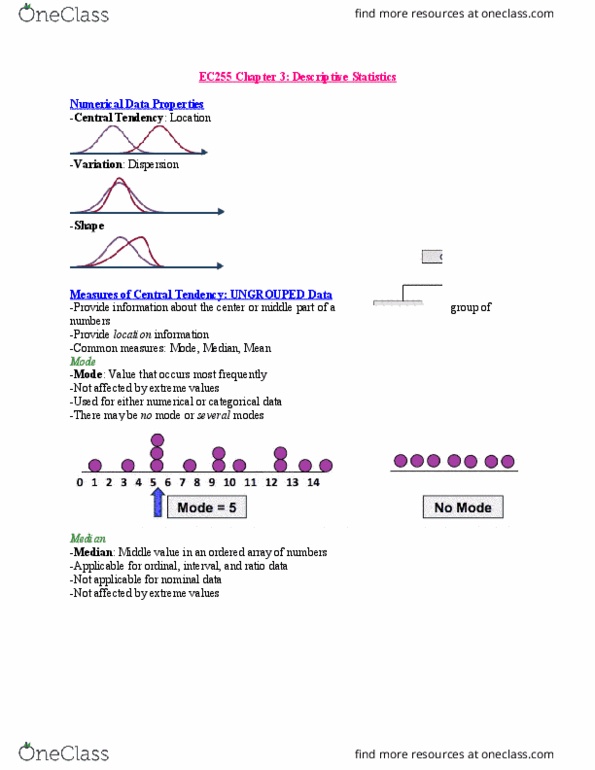
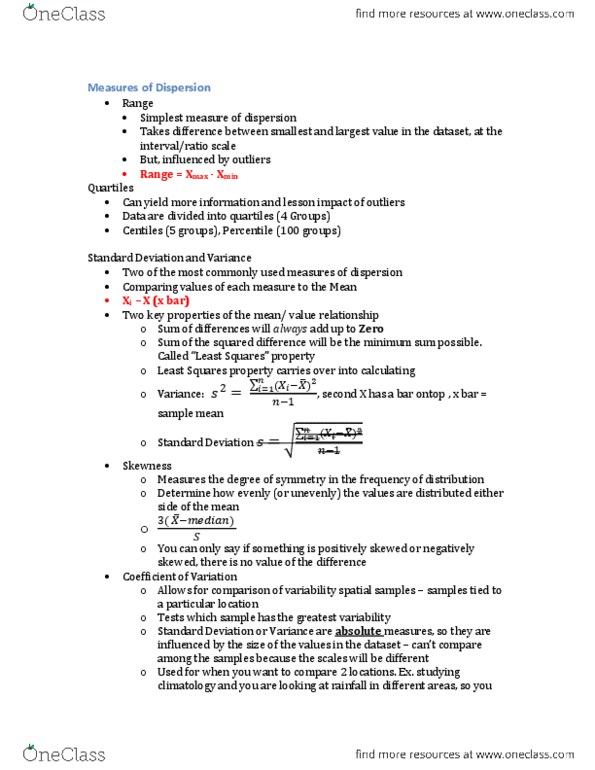
Cas ma 113- lecture 10 notes- computing, graphing and tabulating standard deviation. Variance: a characteristic number that represents how much a dataset varies from the mean. It is the least squares definition of variation. Least squares is a definition system that tries to minimize the sum of the squares of data points (this is not too important: formula for variance: Where n = number of data points, m = mean, xi = datapoint value. Variance = [(x1-m)2 + (x2-m)2 + (xn-m)2]/n. Standard deviation: most commonly used measure of variance, shows variation about the mean, has the same units as the original data. If your dataset is a population the entire group of interest, then the formula for standard deviation is: Population standard deviation: n = number of data points, m = mean, xi = datapoint value, = standard deviation. = ([(x1-m)2 + (x2-m)2 + (xn-m)2]/n)0. 5.