STAT 8010 Lecture Notes - Lecture 1: Bar Chart, Landscape Arch, Agronomy

Document Summary
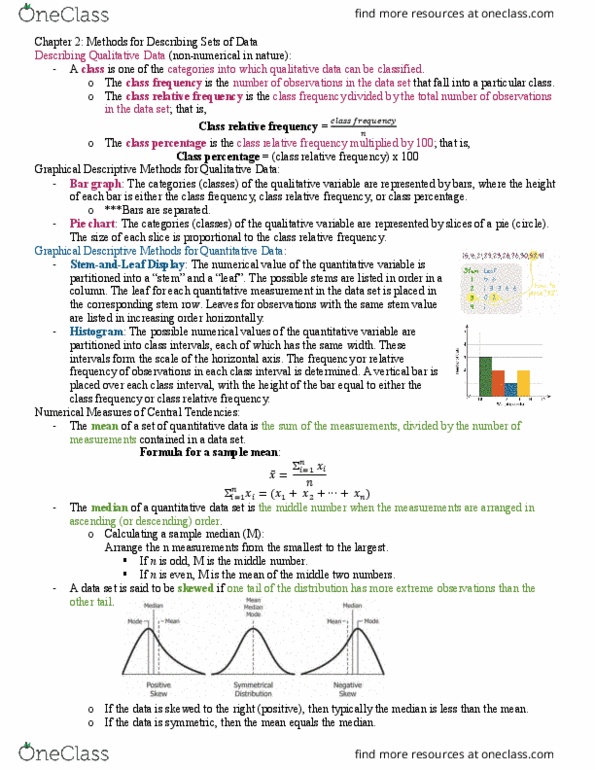
A graphical presentation of data will often reveal information about the sample that is not apparent from a table of data measurements. Goals: to be able to display data using various graphing techniques, to be able to interpret a graphical display. Classes are intervals used to group sample measurements. Class frequency is the number of observations in a particular class. We denote the frequency for a class by fi. Relative class frequency is the proportion of the total measurements that fall in a particular class. That is, the relative frequency for class i is fi/n. Type of graphical display for qualitative data: bar chart. Types of graphical displays for quantitative data: relative frequency histogram, stem and leaf display. Example: below are the major course codes for students in an ex st 301 class. Example: below are math level ii achievement test scores for twenty-eight randomly selected students.