PSY 350 Lecture Notes - Lecture 49: Psy, Statistical Significance, Regression Analysis

Document Summary
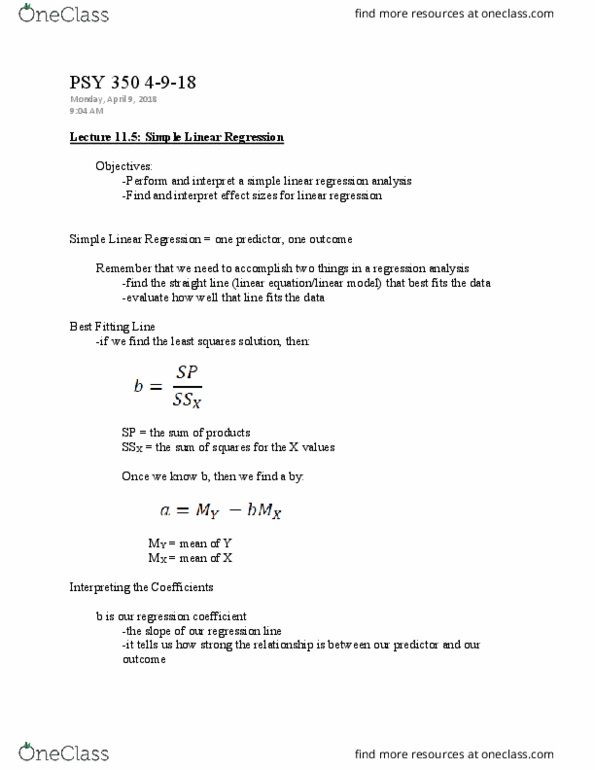
X = value on the horizontal (x) axis. Y = value on the vertical (y) axis a = the intercept of the line. The slope in a linear model tells us how much of an increase (or decrease if it is negative) we can expect in y for every one-unit increase in x. It is very rare for any variable to be able to perfectly predict another variable. So, regression analysis needs to answer two questions. The statistical technique for finding the best-fitting straight line to summarize the relationship between two variables. We want the line that is, on average, closest to all of the data points. We want to minimize the sum of the squared distances between each point and the line. After we find the best fitting line, we test whether it explains a significant proportion of the variance. They are closely related but not the same thing.