QMS 202 Chapter Notes - Chapter 15: Simple Linear Regression, Regression Analysis, Linear Independence

2 Jan 2018
School
Department
Course
Professor
Document Summary
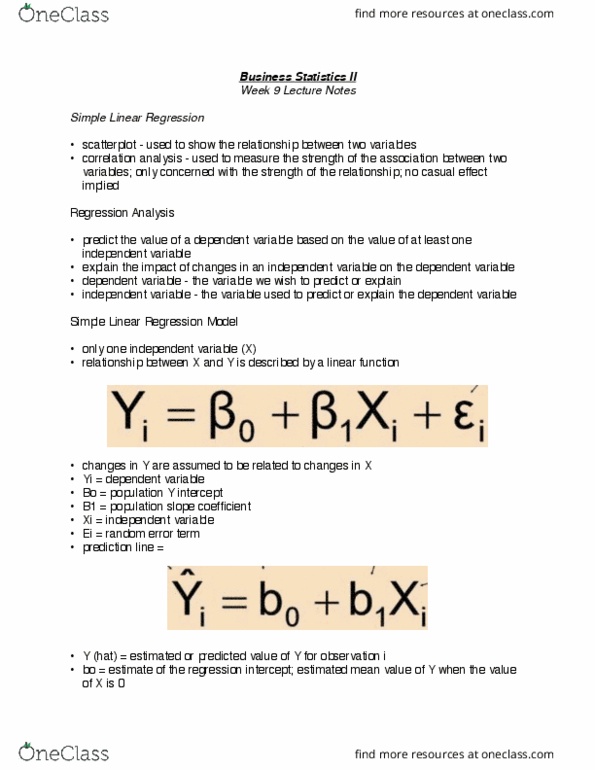
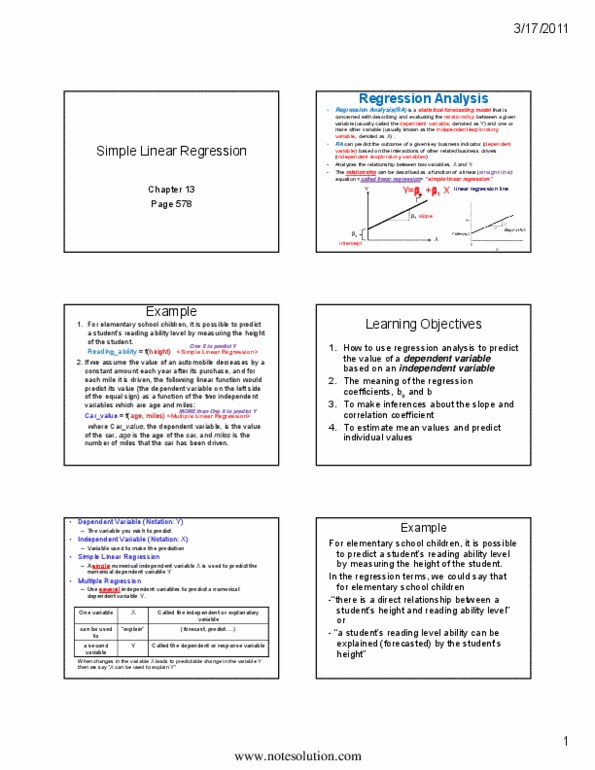
Regression analysis enables you to develop a model to predict the values of a numerical variable based on the value of other variables. Want to predict the dependent variable, variable used to make the prediction is the independent variable. Simple linear regression in which a single numerical independent variable, x, is used to predict the numerical dependent variable, y. Use a scatterplot to examine the relationship between an x variable on the horizontal axis and a y variable on the vertical axis. The proportion of the simple linear regression model is expressed as a straight line. The slope of the line represents the expected change in y per unit change in x. Positive linear relationship / - as x increases so does y. Negative linear relationship \ - as x increases the values of y are decreasing. Positive curvilinear relationship x increases so does y, but the increase tapers off beyond certain values of x.