NEUR 3020 Lecture Notes - Lecture 5: Statistical Significance, Level Of Measurement, Orexin

Document Summary
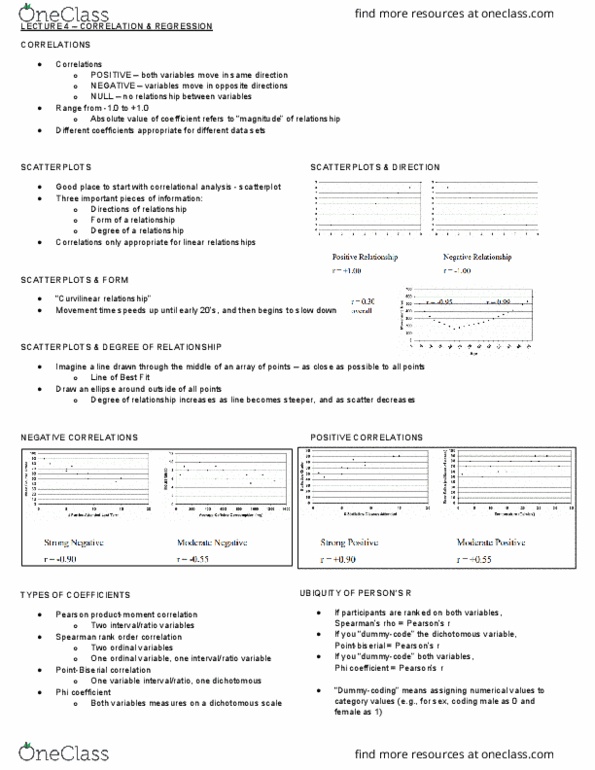
A correlational design- allows the measure of the relationship between of two or more variables. Point biserial correlation: one variable is measured on a binary scale instead of a continuous scale. First step examine a scatter plot: explanatory factory usually on x axis. Can help you determine if two variables have a linear or nonlinear relationship. Those with a curvilinear relationship-(fit by a quadratic curve) would have a pearson product correlation coefficient of zero indicating no relationship because this coefficient measures the strength of a linear relationship only. The pearson product coefficient r - determines the strength and the direction of a linear relationship. Value lies between -1 and 1. r values generally lie within these extremes. Variables restricted to a ratio or interval scale of measurement. r2 is the proportion of variance in one set of measures that is accounted for by variation in the other measure.