ECON 1011 Lecture Notes - Lecture 12: Marginal Utility, Demand Curve


ECON 1011 verified notes
12/30View all
Document Summary
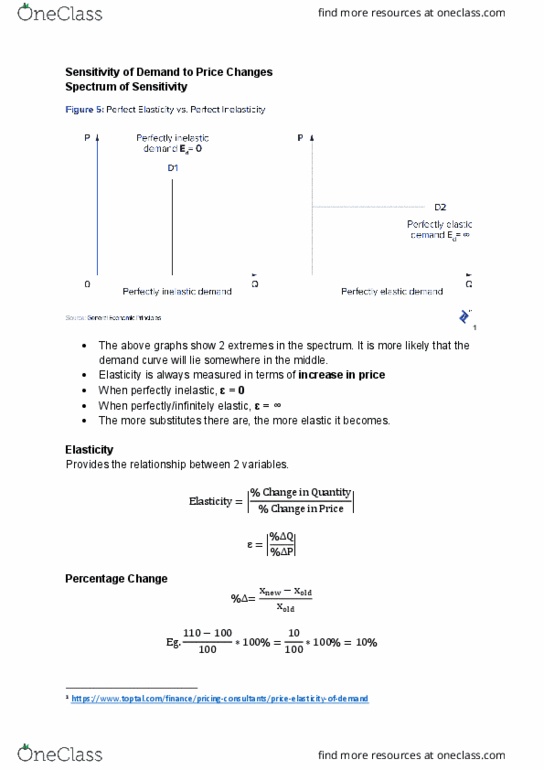
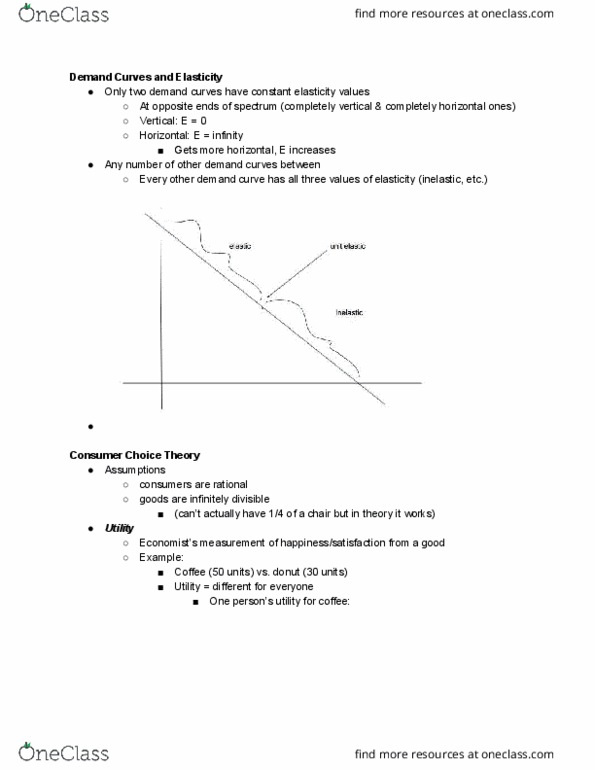
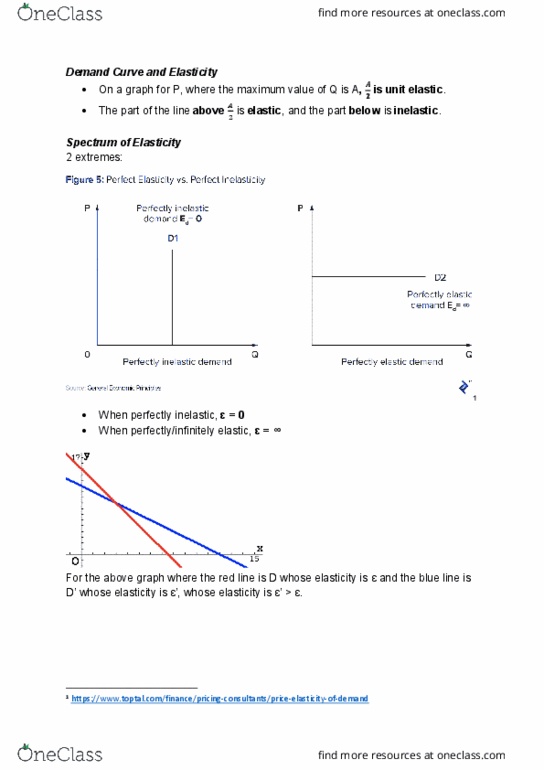
Demand curve and elasticity: on a graph for p, where the maximum value of q is a, is unit elastic, the part of the line above (cid:2870) is elastic, and the part below is inelastic. 2 extremes: when perfectly inelastic, = 0, when perfectly/infinitely elastic, = . For the above graph where the red line is d whose elasticity is and the blue line is. D" whose elasticity is ", whose elasticity is " > . For all points on this demand curve, elasticity is the same. Utility: measurement of happiness/satisfaction (measured in utils: eg. This morning you thought about getting coffee or a donut: the coffee provides 50 utils and the donut provides 30 utils, therefore, you would choose the coffee over the donut. If too much coffee (x-axis) is consumed, then your happiness (utlity; y-axis) would decrease after peaking at the top (satiation point). The utility you get from consuming 1 more unit. (utility change per unit)