MATH 10041 Lecture Notes - Lecture 8: Graphing Calculator, Scatter Plot

27 Feb 2019
School
Department
Course
Professor
Document Summary
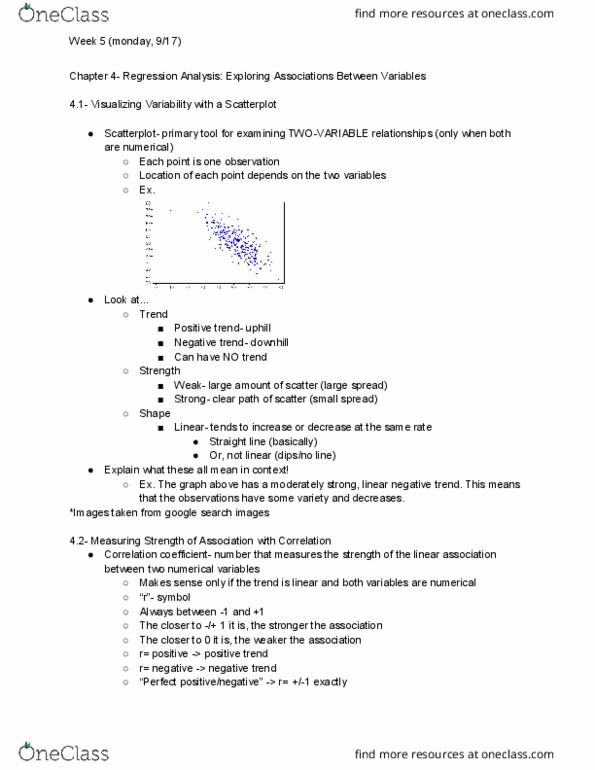
Trend the general tendency of the scatterplot as you read from left to right typical trends increasing, called a positive association: decreasing, called a negative association, no trend, if there is an uphill nor downhill tendency. Strength of an association: scatterplots with large amounts of scatter or vertical variation indicate a weak association, scatterplots with small amounts of scatter or little vertical variation indicate a strong association. Shape: linear: scatterplots that cluster around a line model linear trends this scatterplot shows there is a linear association between volume of searches for the word vampire and the word zombie . Shape: non-linear: sometimes there are trends in data that are non-linear trends that are better modeled by a curve rather than a line. Writing descriptions of associations: when writing a description of an association between two numerical values, always include, trend, shape, strength in addition, mention any observations that don"t fit in the general trend (if any)