MATH 10041 Chapter Notes - Chapter 4: Scatter Plot

28 Feb 2019
School
Department
Course
Professor
Document Summary
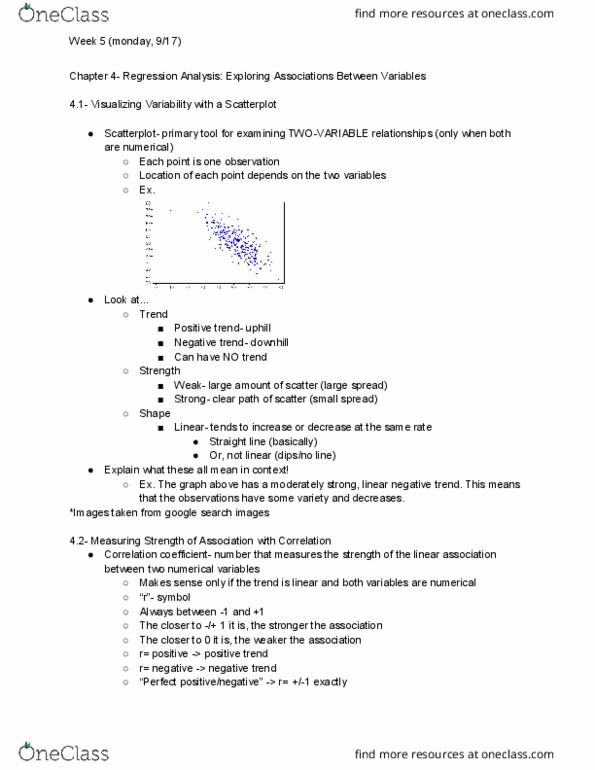
Linear trend: trend can be summarized with a straight line: always increase or decrease in a straight line. Correlation: a mutual relationship or connection between two or more things: does not imply causation. Correlation coefficient: a number that measures the strength of the linear association between two numerical values: measures the strength of a linear association, compares z-scores of the two variables. The products of the two z-scores for each point are averaged: the sign tells us whether the trend is positive or negative. However, if you already know the association is linear, then the correlation coefficient tells you how strong the association is. Influential points: the presence has a big effect on conclusions. Aggregate data: those for which each plotted point is from a summary of a group of individuals. Extrapolation: means that we use the regression line to make predictions beyond the range of our data.