ACMS10145 Lecture Notes - Lecture 8: Central Limit Theorem, Confidence Interval, Interval Estimation

19 Feb 2019
School
Department
Course
Professor

1
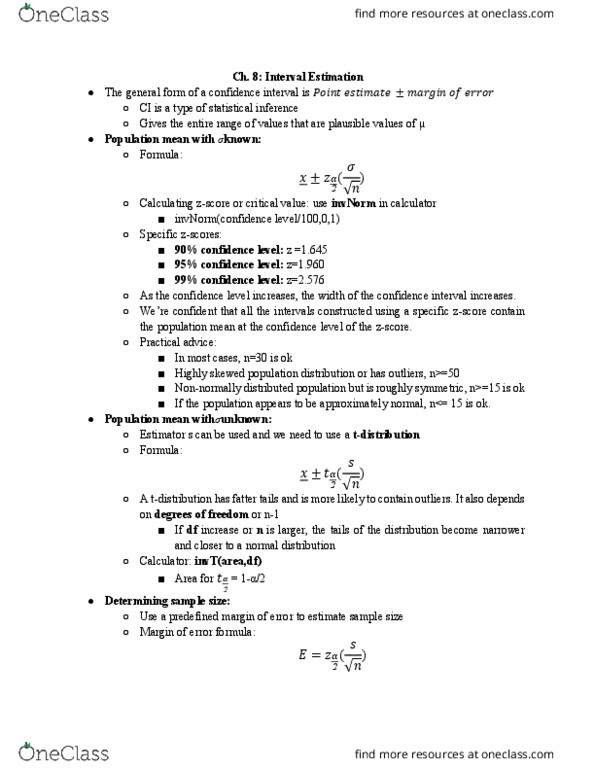
Chapter 8: Interval Estimation
In Chapter 8 we address one major type of statistical inference, the confidence interval.
We will see different forms of confidence intervals for means and proportions under
different assumptions. The general form of a confidence interval is
!"#$%&'(%#)*%+&,-*./#$&"0&'..".
We discussed point estimates in Chapter 7, and we’ll see that the margin of error is a
quantity that is calculated based on the concept of sampling distributions.
8.1 Population Mean: 1 Known
A confidence interval is a type of statistical inference. If we wish to estimate a population
mean 2, we know that our point estimator 34 provides an estimate. However, there is only so
much a single number can tell us. How well have we determined the mean?
Informally speaking, a confidence interval gives us an entire range of numbers that are
plausible values for 2. We will spend more time later talking about the precise
interpretation of a confidence interval.
First, we’ll see the formula for a confidence interval for 2.
As usual, the text presents formulas cases for when the population is known and when it is
unknown. We get introduced to confidence intervals in the context of assuming the
population is known which is, of course, unrealistic. We begin our discussion with an
exercise from the text.
Example (exercise 6 on page 315): Nielsen Media Research conducted a study of household
television viewing times during the 8pm to 11pm time period. The data showed that the
sample mean for the amount of time watched per week by $5677 households was 34589:
hours. Based on previous studies the population standard deviation is assumed known with
;569: hours.
Now, from the Central Limit Theorem we know that the sampling distribution of means of
all samples of size 300 is normal with mean 2, and standard deviation ;
<4
5
=
>?
.
find more resources at oneclass.com
find more resources at oneclass.com

2
Using the Empirical we know that approximately 95% of the random samples of size
$5677 taken from the population will have an average 34 in the interval:
@2AB9CD;
>$E2FB9CD;
>$G
That is, we are 95% sure that
2AB9CD;
>$H&34&H2FB9CD;
>$
Or, equivalently,
AB9CD;
>$H&2A34&&HB9CD;
>$
Or, going one step further, we have:
34AB9CD;
>$H&2&&H34FB9CD;
>$
In our case, this says we are 95% sure that
89:AB9CDI69:
>677 589B&&H&2&H89:FB9CDI69:
>677 589C
The interval (8.1, 8.9) here is called a Confidence Interval and 95% is the Level of
Confidence we have in our estimate.
Another interpretation of our result is that if we were to draw a very large number of
samples of size 300 from the population of households, then 95% of those intervals would
contain the true population average,&&2.
The general formula for a B77JBAKLM confidence interval is given by
34,N
OP
Q
;
>$
Here N
OP
Q
is a z score which is also referred to as a “critical value”.
warm
C975,0 1
seas
o9s
EnuNorm
4995,91
2.576
find more resources at oneclass.com
find more resources at oneclass.com

3
Example (exercise 10 on page 315):
Playbill
magazine reported that the mean annual
household income of its readers is $119,155. Assume this estimate of the mean annual
household income is based on a sample of 80 households, and based on past studies, the
population standard deviation is known to be ;5R67E777.
1. Develop a 90% confidence interval for the mean
2. Develop a 95% confidence interval for the mean
3. Develop a 68% confidence interval for the mean
4. What happens to the width of the confidence interval as the confidence level increases?
I119155
n80
530000
XI2In 119155 I1.645 soooooo
113637 50,5
124672.50
112580.96 125729.0L
119155 I1.96 t303
5827702,122488 gg
115819.487 122490.513
Inu Norm f84,0 11 994
119155 I994 q
As the confidencelevel increases the width
of the confidence interval also increases
find more resources at oneclass.com
find more resources at oneclass.com
Document Summary
In chapter 8 we address one major type of statistical inference, the confidence interval. We will see different forms of confidence intervals for means and proportions under different assumptions. The general form of a confidence interval is. We discussed point estimates in chapter 7, and we"ll see that the margin of error is a quantity that is calculated based on the concept of sampling distributions. A confidence interval is a type of statistical inference. If we wish to estimate a population mean 2, we know that our point estimator 3 provides an estimate. However, there is only so much a single number can tell us. Informally speaking, a confidence interval gives us an entire range of numbers that are interpretation of a confidence interval. plausible values for 2. We will spend more time later talking about the precise. First, we"ll see the formula for a confidence interval for 2.