B A 360 Lecture Notes - Lecture 13: Process Capability, .Gg

Document Summary
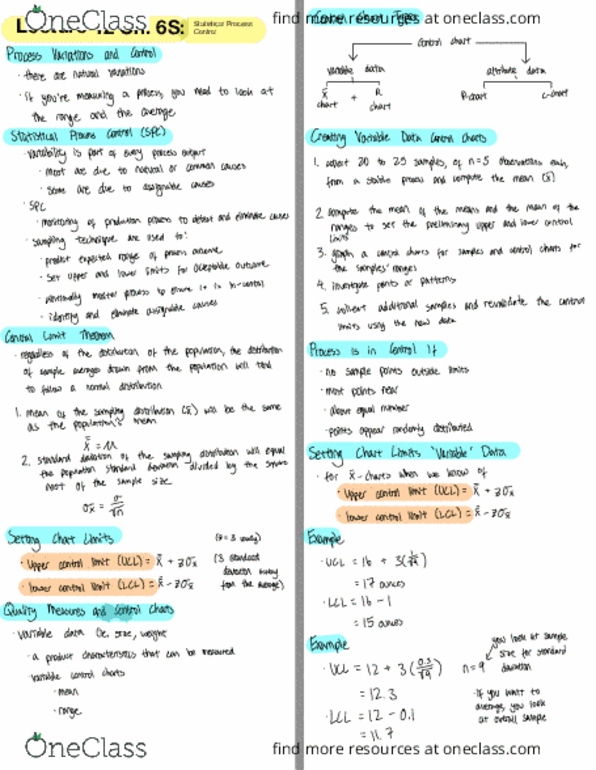
Three major management and decisions : that need. Select determine the appropriate in the processes charting technique get dear policies and procedures sample size. 100 parts in a sample larger sample site n - Control percentage detective in a sample number of deters in an item. " p - charts - c - charts - using p - chart. Lll = f - 2- op op = n. Ucl = 6. 67 t 3 - 2. 58. 20 - 100 gp = upper specification limit - lower specification limit process capability p = n = 100 look at graph. 6 consecutive points up one side of the center line or down across zones lo points alternating up or down. 3 consecutive points in zone a but still inside the control limits. 5 consecutive points in zone a or b have a cp for higher.